Simscope Release History — v480 — 489
1.489
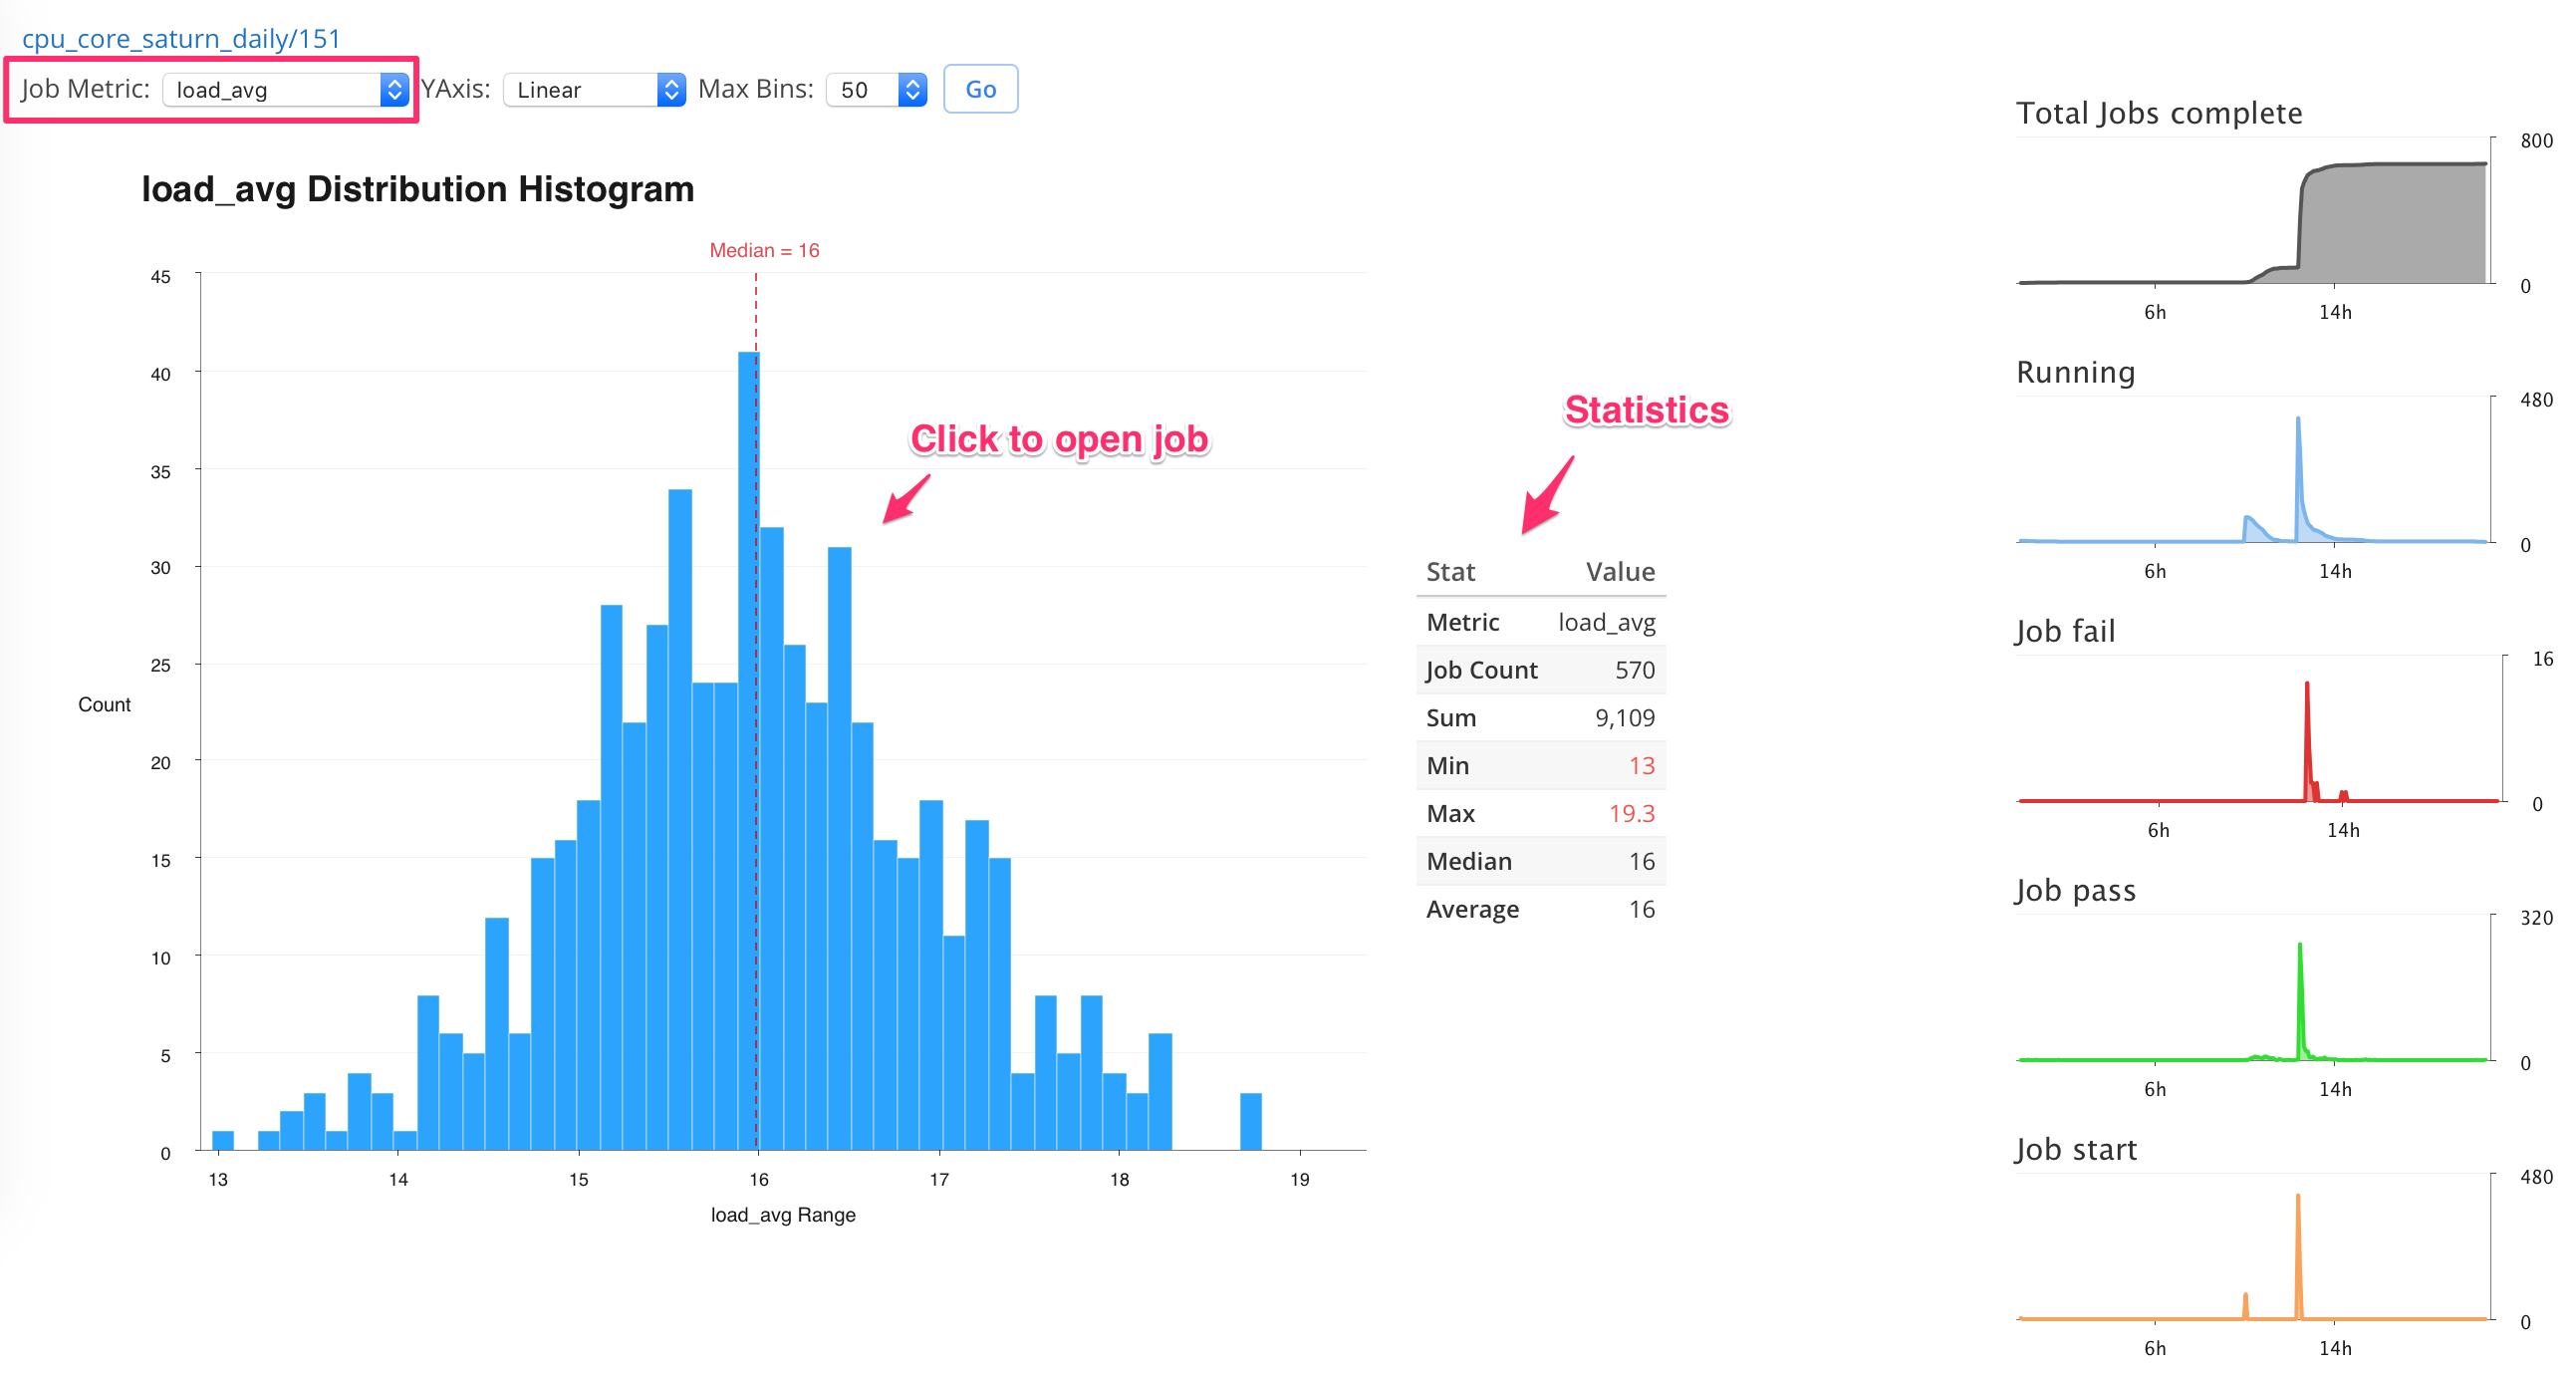
1. feature Histogram drilldown
Users can click Histogram bins, to drill into a list of jobs within the bin.
2. bugfix My Searches
Moved the My Searches dropdown to the right of the List button, to make it easier to use.
1.488
1. bugfix User access bug fixed
SIMSCOPE-105
In previous releases, there was a bug where re-enabling disabled users could result in a user which cannot access certain pages.
This bug is now fixed.
2. bugfix Gantt sort by duration
Gantt chart sort by duration now works.
3. feature Gantt ascending and descending sort
Gantt charts can now be sorted in ascending or descending order.
4. feature Increased Gantt limits
Increased Gantt chart limits from 1000 to 2500 events, to allow for larger charts.
1.487
feature Coverage Merge
SIMSCOPE-81, SIMSCOPE-93
Coverage DB models can now be dynamically merged into a single model.
1.486
1. feature Coverage DB search and charting
This release includes a Beta feature of Coverage DB model searching and charting.
Users can filter models by:
- Regression
- Date
- Coverage Group
- Coverage Point
Users can chart model scores, with series grouped on:
- Coverage Model
- Coverage Group
- Note that charts can be filtered by coverage group/point as well.
2. feature Compressed coverage model publish
Coverage DB models can now be published with compression enabled, so that larger models can be sent as messages.
3. bugfix Improved login error message
Login errors now indicate the admin email address, to give better contact information to the end user.
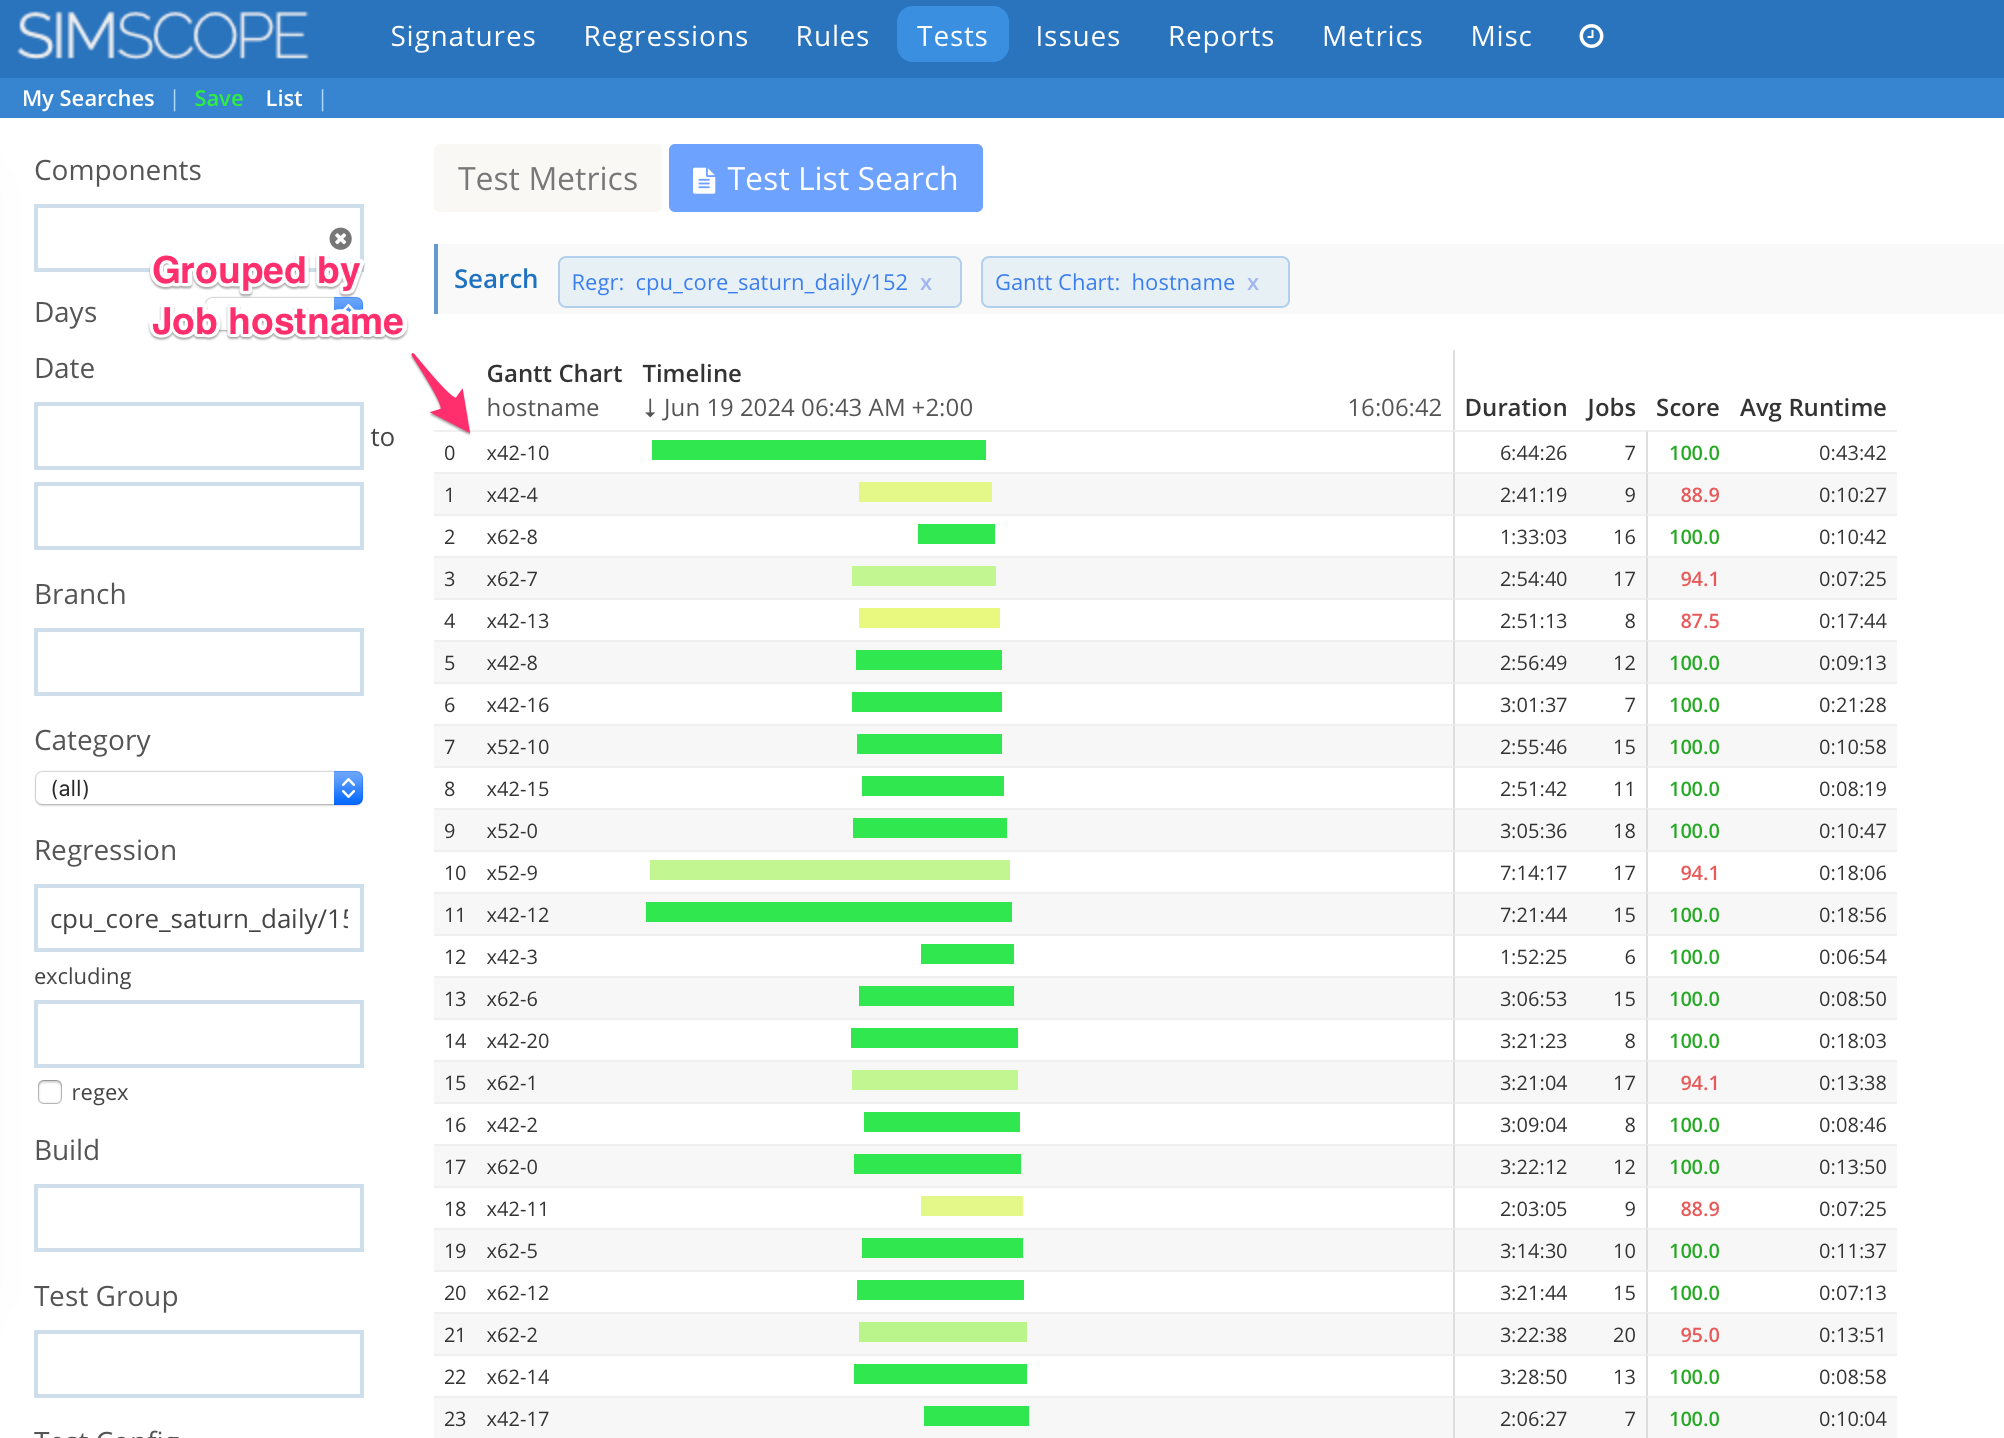
4. feature Gantt by Job Hostname
Regression Gantt Charts can now be grouped by Job Hostname.
5. bugfix Chart drilldown bug
In previous releases, when clicking on chart data to drilldown into a test search, the build and test group fields would be omitted from the drilldown URL.
This bug is now fixed.
1.485
1. feature Azure Application Authentication
Simscope can now authenticate with Azure/ADO using Application Authentication, instead of Personal Access Tokens.
2. feature Regression compare improvements
Regression compare improvements:
- Allows filtering of signatures by Build and/or Test Group fields.
- Compare now allows up to 1000 signatures per regression, shown side-by-side.
- Added percentage delta of signature counts.
3. bugfix Scatter plot chart hover fix
When hovering over regressions in regression scatter plots, the previous releases could render the wrong regression link.
4. bugfix Coverage group vertical scrolling
The coverage DB now renders coverage groups with a vertical scroll bar, to make it easier to select and drill-down into coverage groups.
1.484
1. feature Regression Details Improvements
Improved Regression Details page to access:
2. feature Added simscope-assignments.py script
The simscope-assignments.py script can be used to:
- List active assignments for a user, grouped by Issue (ie bug/tag).
- Unassign a specific Issue (move back to NEW state).
- Auto-unassign one or more issues, based on name of the issue.
3. feature Float job metadata rounding
Added automatic rounding of floating-point job metadata to 3 decimals.
4. bugfix Fixed NULL behavior in numeric metadata
Numeric job metadata values (int, uint64, float) now handle NULL (ie blank) values properly during comparisons expressions:
- Greater-than, Less-than, and Not-equals operators now treat NULL numeric metadata value as non-match.
- Previously these would be incorrectly coerced as a zero value.
1.483
1. bugfix Bulk User Group join/leave for administrators
In previous versions, Bulk User Group Join/Leave would fail if Administrator users were selected.
→ This bug is now fixed.
2. bugfix Running=0 bug
In previous versions, if updating the Regression JSON running
value to 0 (zero), this value would be ignored incorrectly.
→ This bug is now fixed.
3. bugfix Page sharing for secure projects
Page Sharing now follows the session user privileges, so that secure project data can be shared.
4. feature Added Histogram link to regression details page
There is now a Histogram link, to view a regression histogram directly.
1.482
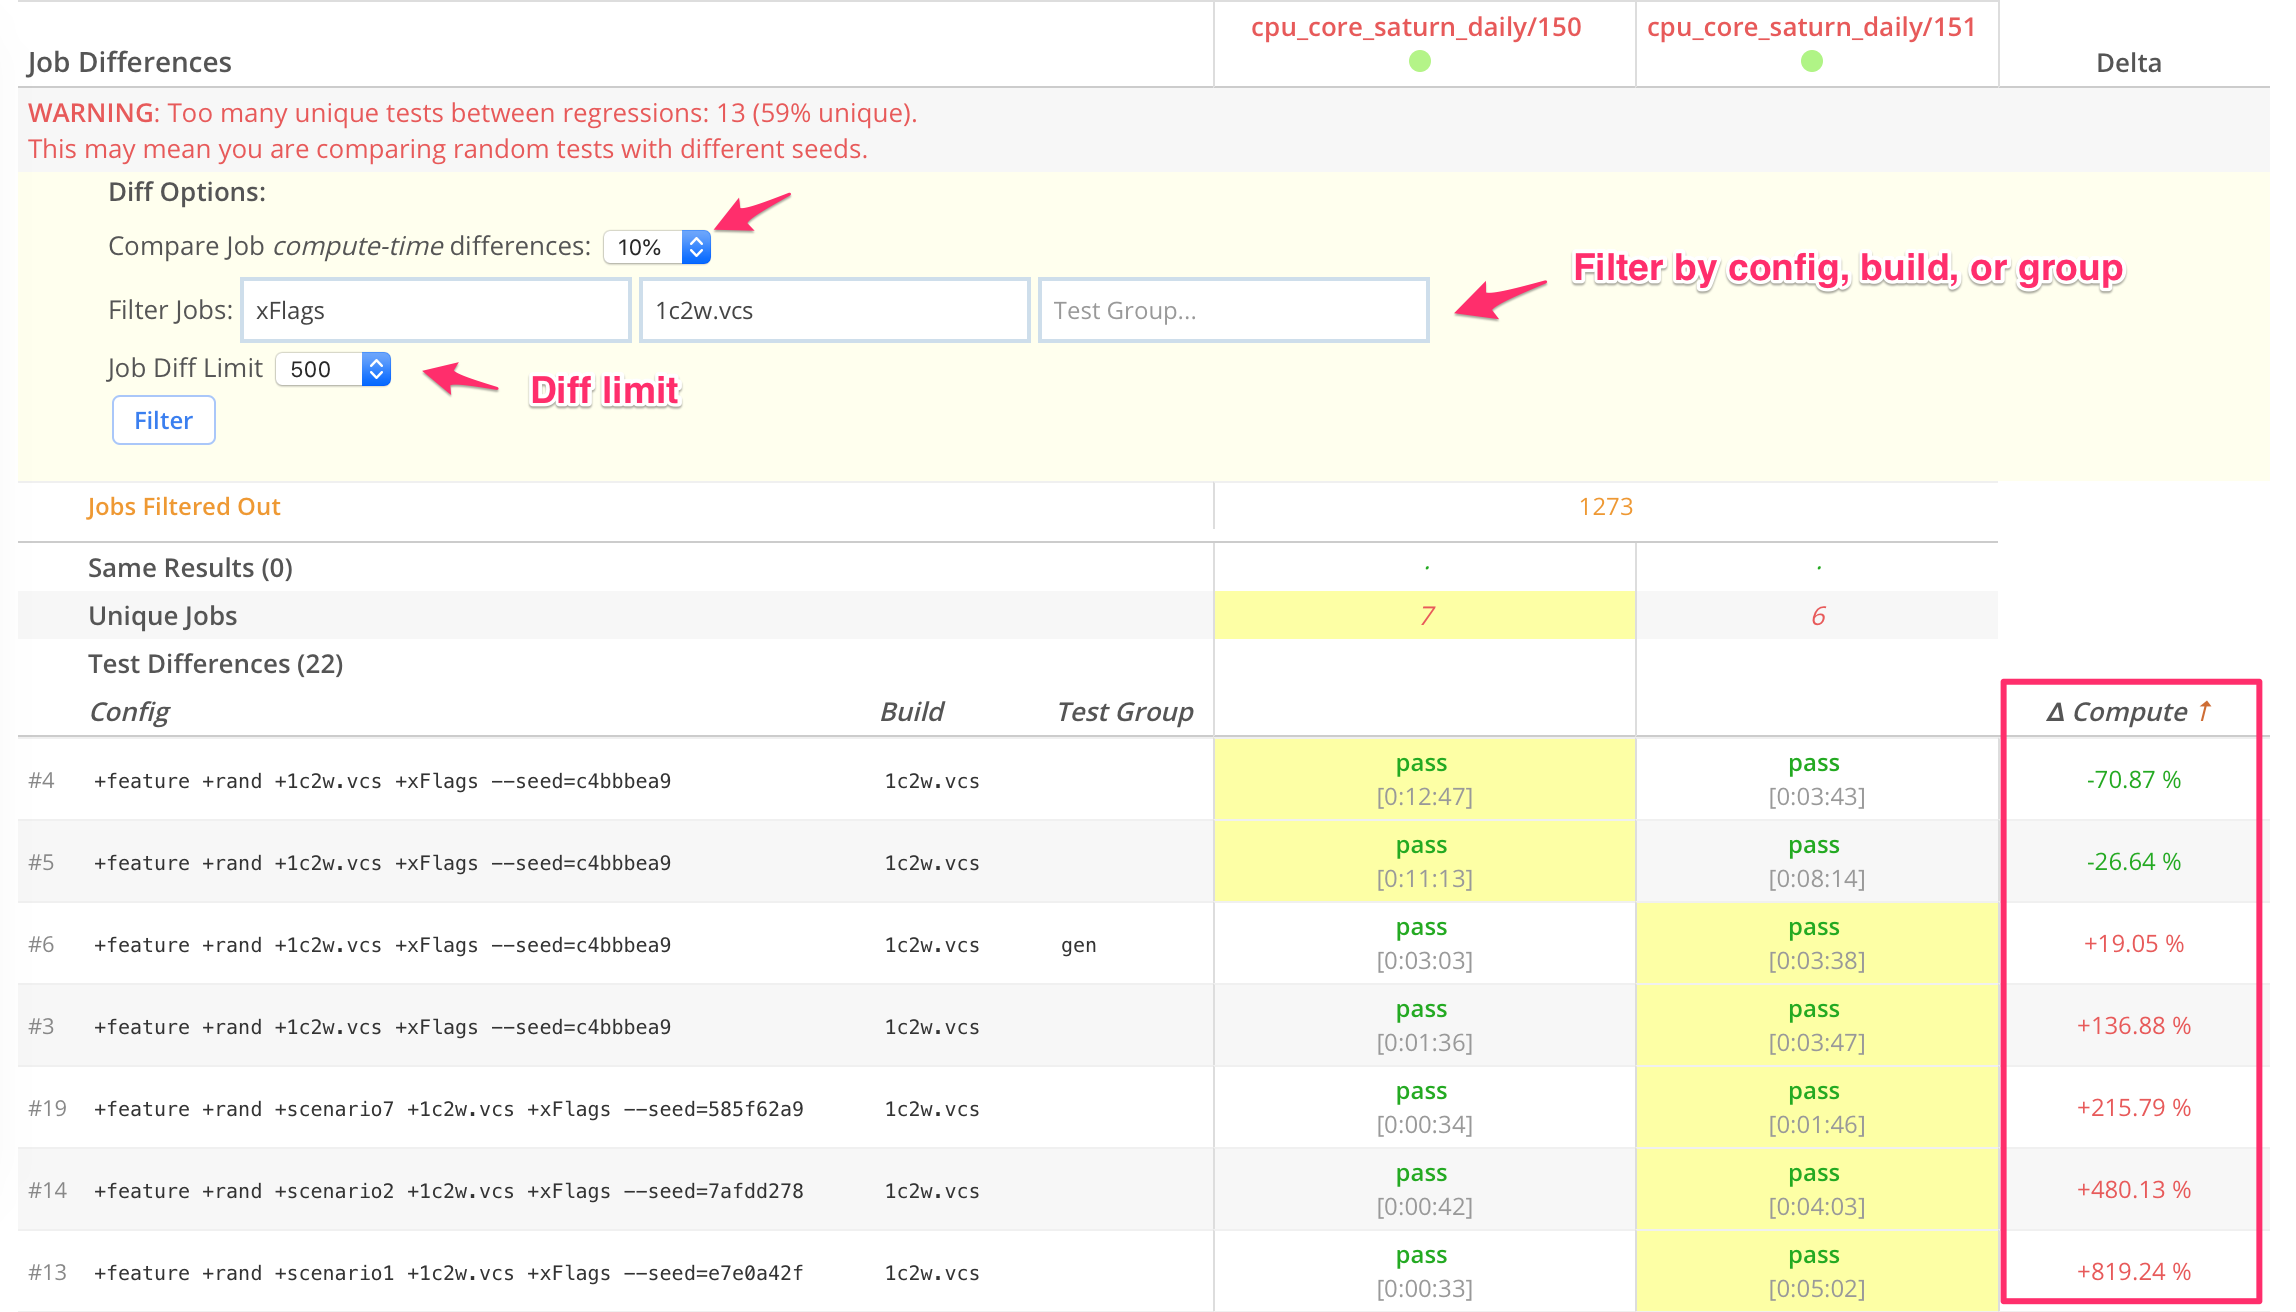
1. feature Improvements to Regression Compare (Diff by Job)
- Filter by Build
- Filter by Test Group
- Filter by Test Config
- Added job limit increase. Previously this was limited to 500 differences. There is now an option to show up to 5000 differences.
- Compute Time Delta: now shows a percentage change column.
2. feature Improvements to the Regression Histogram
- Click any histogram bucket in the chart, and it will open a job details page.
- Added statistics table: Min, Max, Sum, Avg, Median
3. bugfix Fixed job sort by CPS
Job sort by CPS was broken in previous releases, for jobs with CPS greater than 1000.
1.481
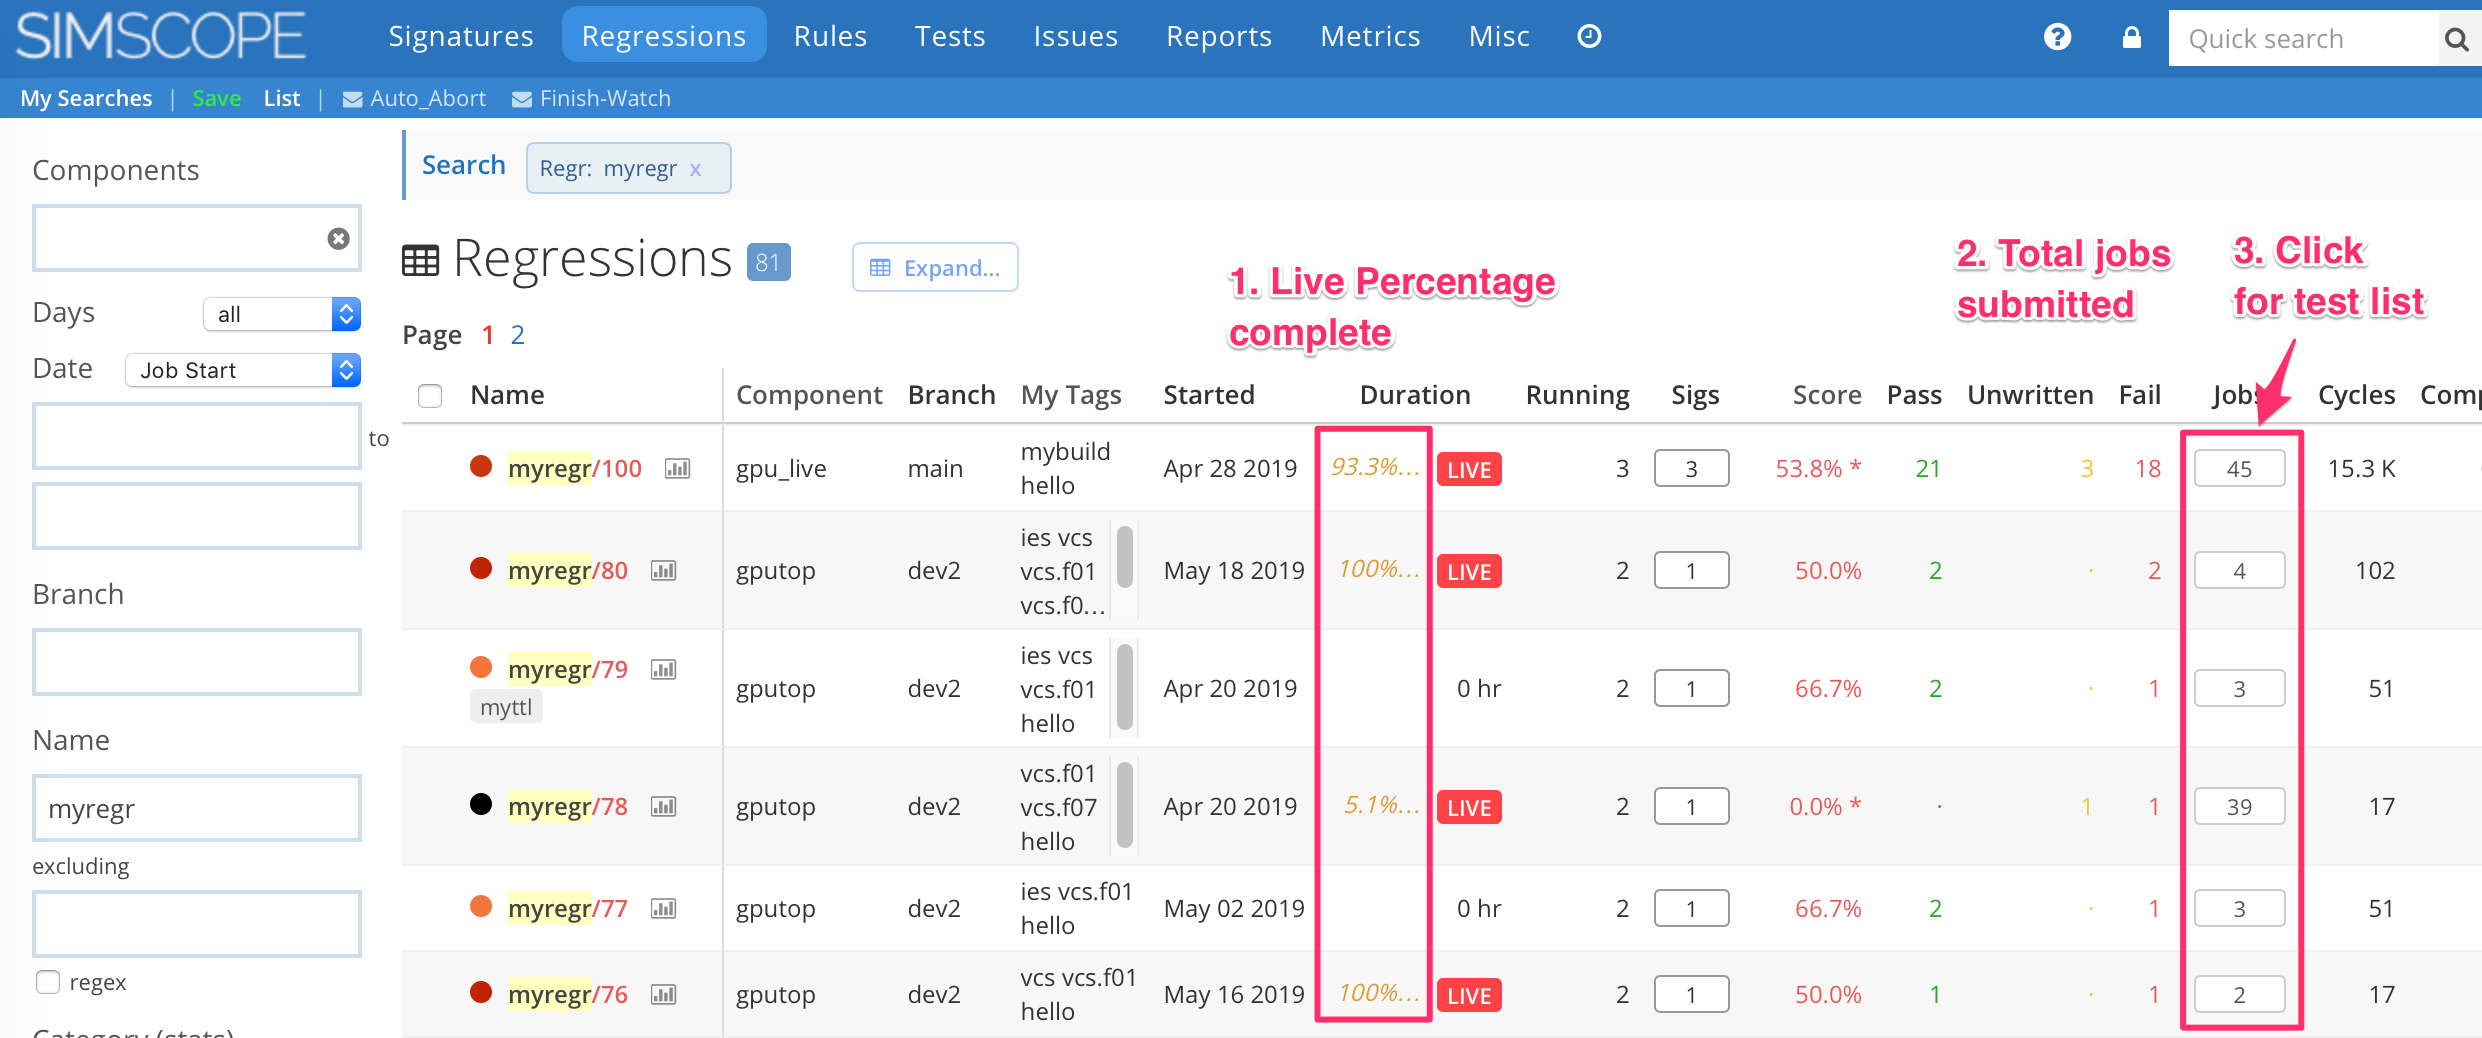
feature Improvements to the Regression Search Table
Three improvements:
-
For Live Regressions, the Duration column now shows a text-based percentage of completion percentage (e.g.
85%, instead of a red progress bar. -
The
Jobscolumn now represents Total jobs submitted in the regression (including Running/Submitted), instead of total finished.
# Note: Jobs column is the greater of: (running/finished) and (submitted)
Jobs = MAX(Running + Pass + Fail + Skip, Submitted)
- When clicking the
Jobscolumn, this now hyperlinks to the test list view, to view all jobs in a regression.
Example screenshot:
1.480
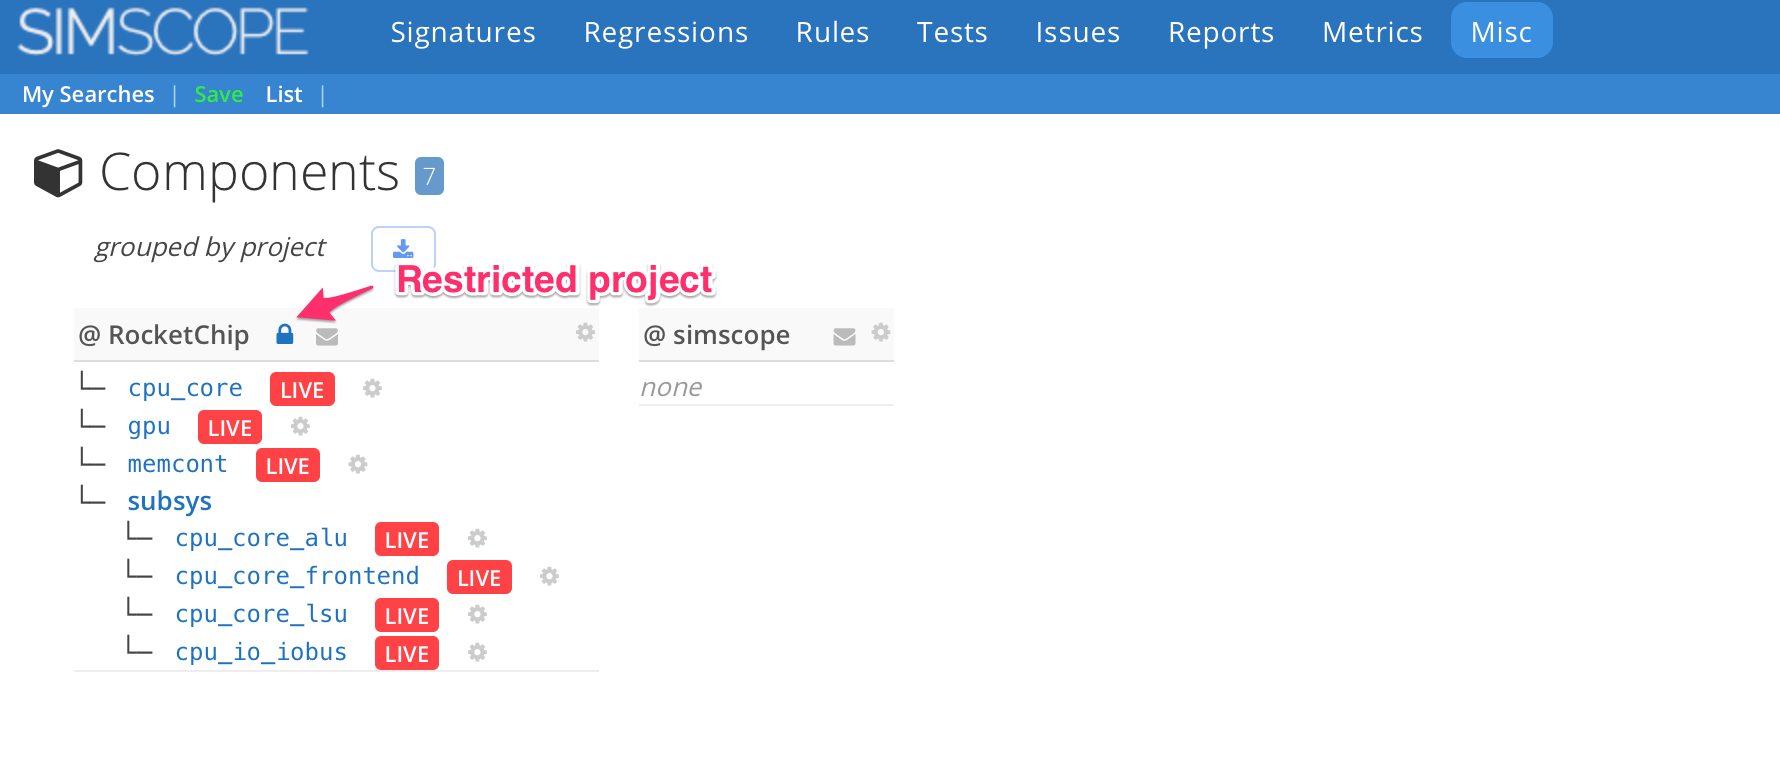
1. feature Added Restricted Projects
Projects can now be restricted to users of a specific User Group.
For example, to restrict Project sandstorm to users in the group army:
[project "sandstorm"]
# Project User Group restrictions
group = "army"
Notes:
- Administrators are members of all groups, so they can always access any project.
- Ungrouped projects are by default public.
2. feature Added simscope-dashboard-download and simscope-dashboard-upload scripts
Added two new Python scripts to help with Metric Dashboard download/upload. This can be used to either:
- Create dashboards from scripts
- Copy dashboards between Simscope instances
To download a dashboard (including its charts) to a JSON file:
- Note: replace
SOURCE-simscopeandSOURCE_APITOKEN
> bin/simscope-dashboard-download.py "username/My Dashboard" -o dashboard.json \
--addr=http://SOURCE-simscope:1234 --apitoken=SOURCE_APITOKEN
- This will download "username/My Dashboard" into file
dashboard.json
To upload a dashboard JSON file (including its charts):
- Note: replace
DEST-simscopeandDEST_APITOKEN
> bin/simscope-dashboard-upload.py "username/My Dashboard2" -i dashboard.json \
--addr=http://DEST-simscope:1234" --apitoken=DEST_APITOKEN
- This will upload
dashboard.jsonto "username/My Dashboard2"
3. feature Added Regression live-auto-refresh
When viewing Live Regressions in the browser, Simscope will now automatically refresh the web page periodically as the regression makes progress.