Simscope Release History — v430 — 439
1.439
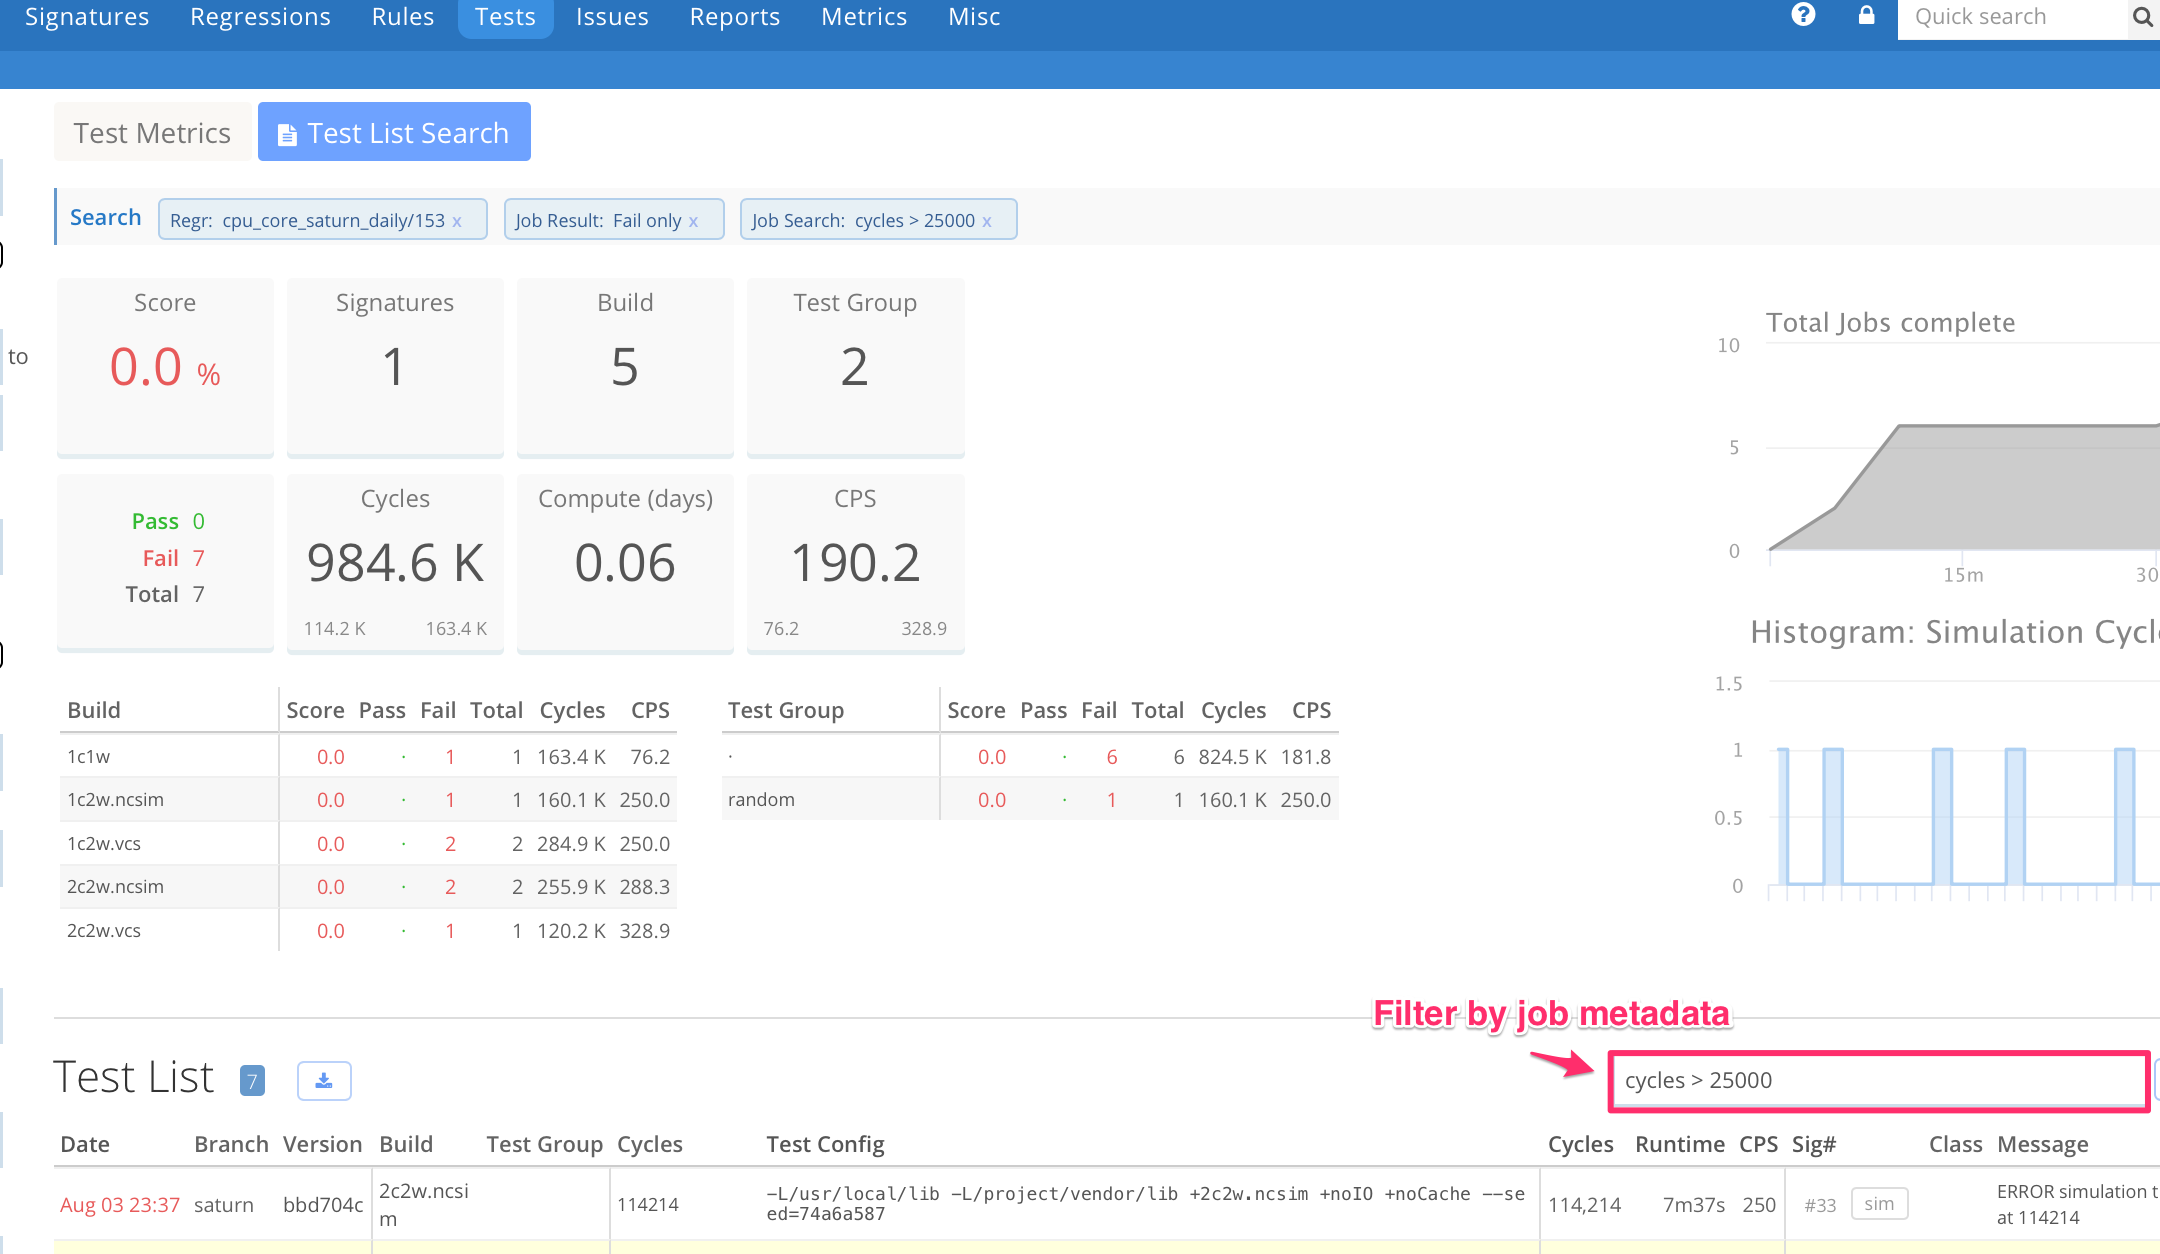
1. feature Test List Search filtering by Job Metadata
You can now filter by job metadata from the Test List Search page.
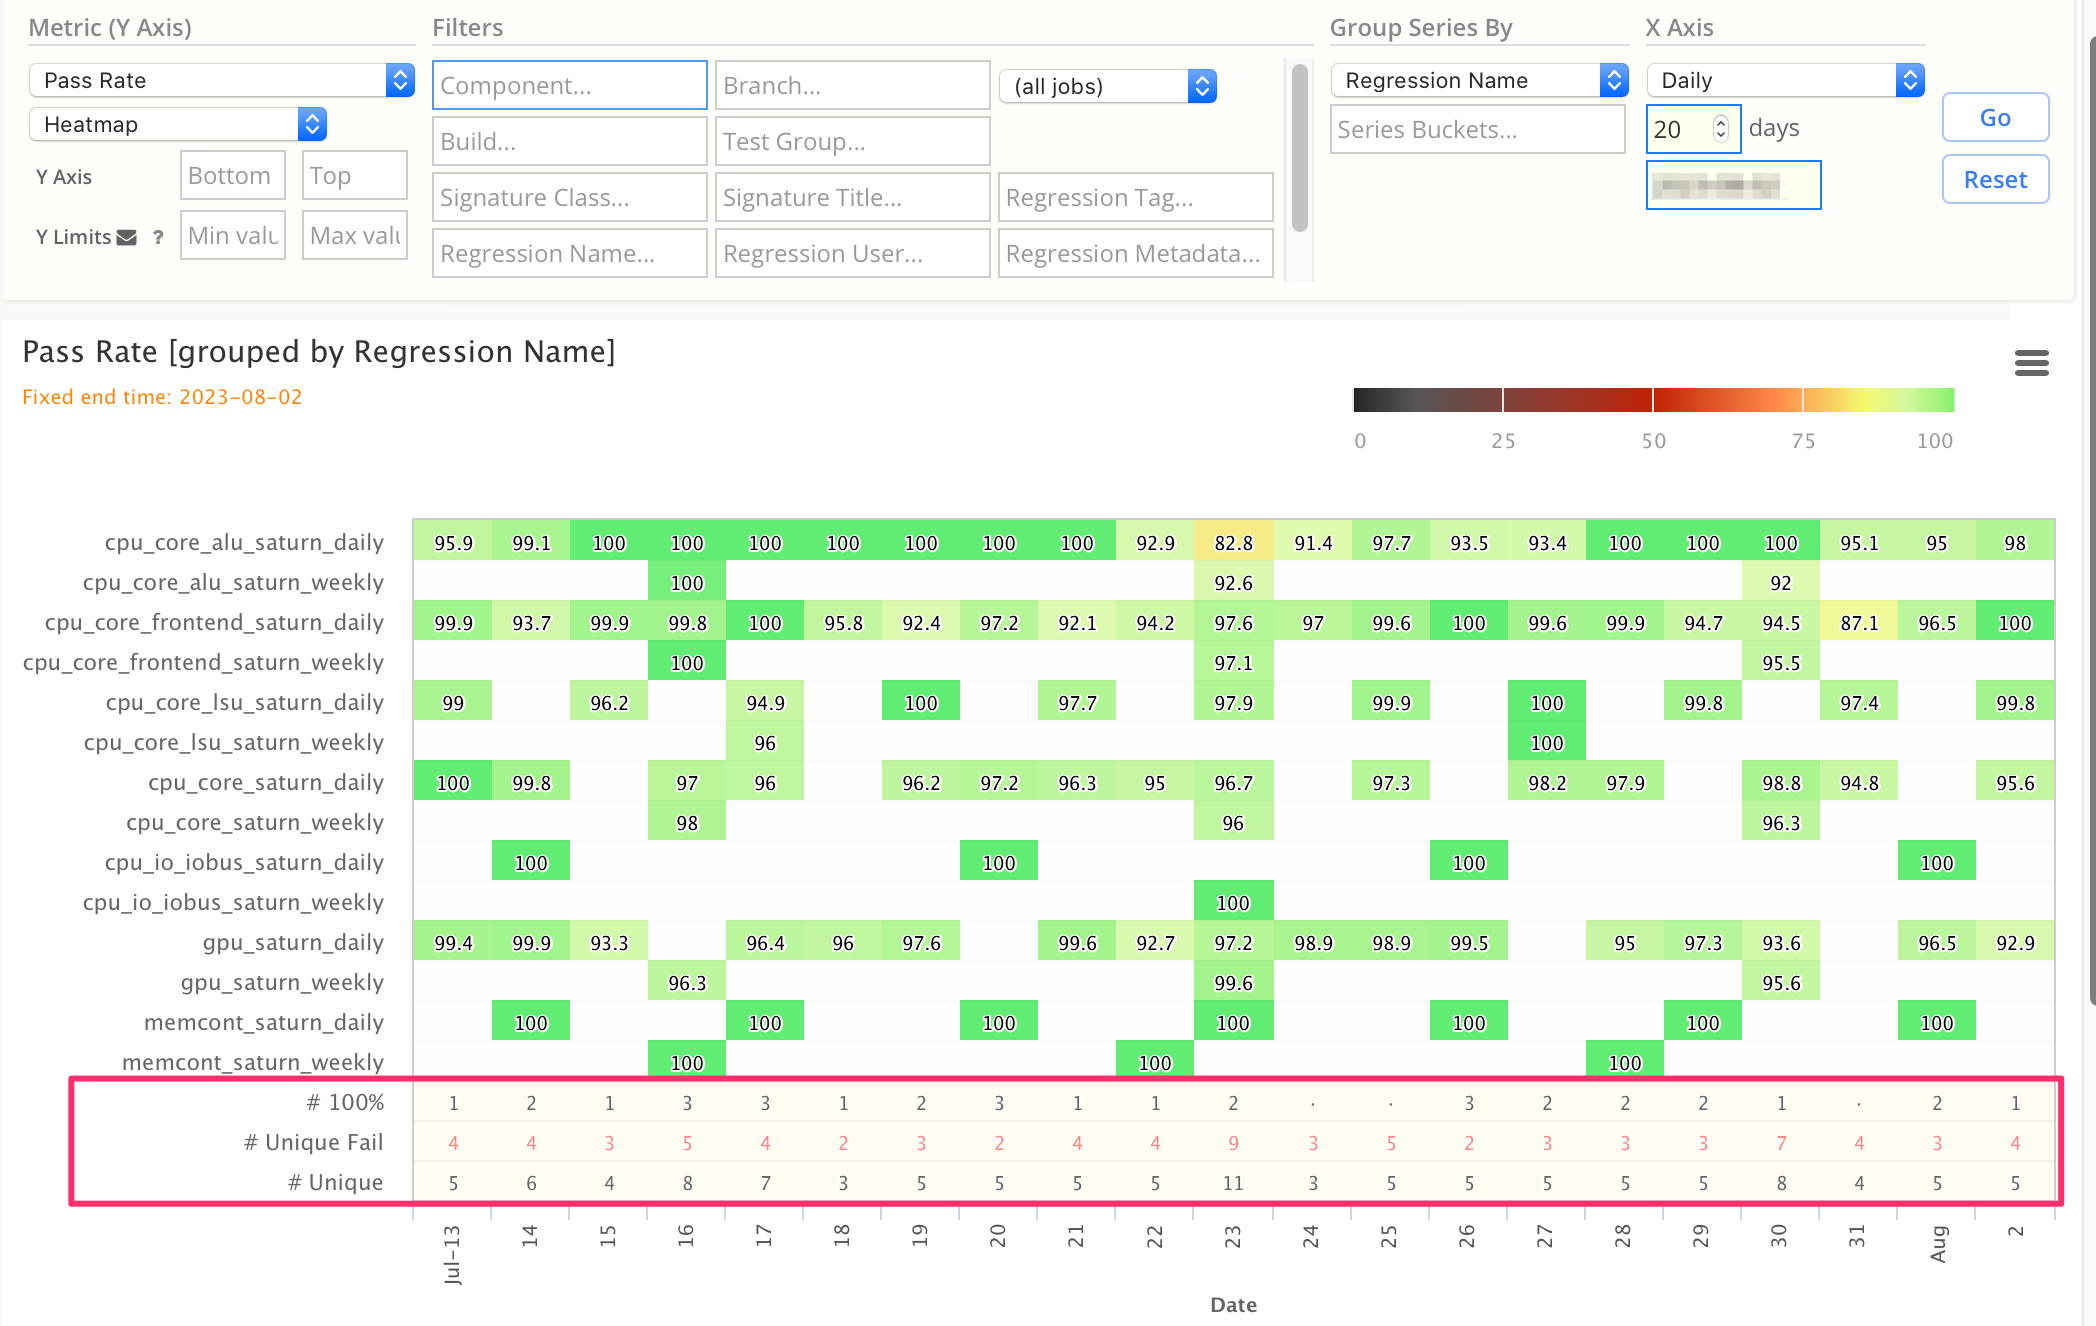
2. feature Added heatmapsummary config option, to add summary rows in Heatmaps
If this is enabled in simscope.config:
[chart]
# Optional: add summary rows under heatmaps, to indicate the number of unique elements in each column
heatmapsummary = true
Simscope will display additional summary rows at the bottom of Pass Rate heatmap charts:
# 100%# Unique Fail# Unique
3. feature Filter regressions to show latest single completed regression
Regressions can now be filtered by Latest finish, which will filter to the most-recent single Regression that has completed.
- In other words, this sets the filters
Limit=1andLive=false
1.438
1. feature Increase Job Category limit
Job categories can now be increased beyond 9, via the config option maxcategories.
- Note: for simplicity, the number must be set to a multiple of 10 (although the actual count is one less).
For example, to increase job categories to 99, add this to your simscope.config file:
[sigs]
# Increase job categories to 1-99
maxcategories = 100
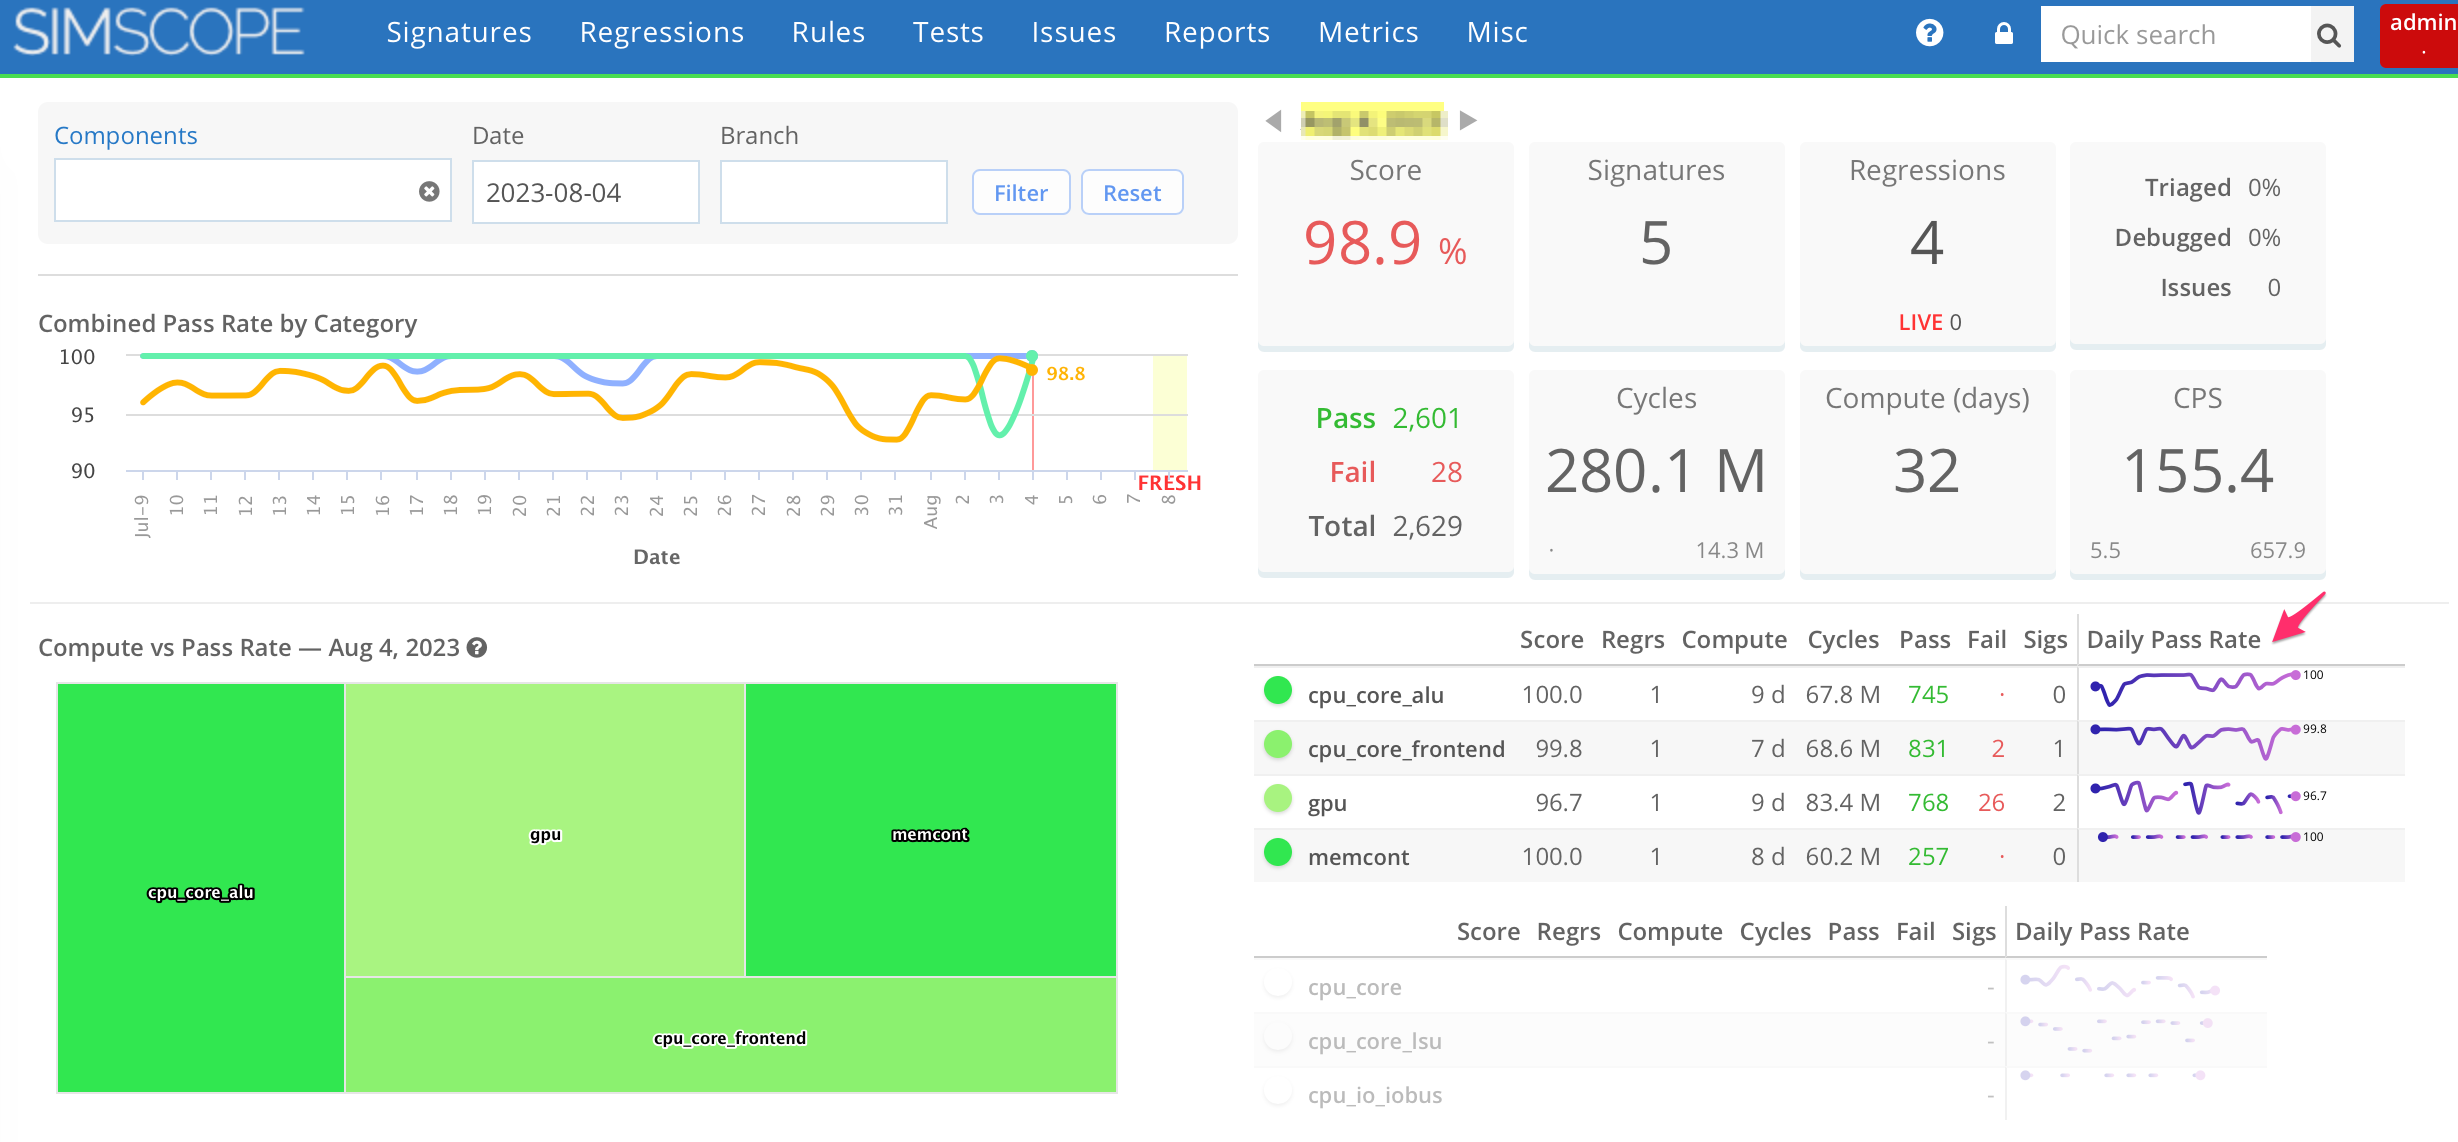
2. feature Sparkline chart option for homepage
For groups that prefer sparklines over heatmaps, the Simscope homepage and status pages can optionally be switched to show sparklines charts instead of heatmaps.
To switch, edit your simscope.config file and add:
[chart]
# Optional: switch the Simscope homepage/status page to use sparkline charts instead of heatmaps
statuslinechart = true
Here is an example homepage with sparklines enabled:
3. feature Added user filter for component status page
The component status page can now filter by regression Launch User.
1.437
1. feature Added dashboard auto-refresh
Dashboards can now be auto-refreshed on an hourly or daily basis, in the browser.
2. feature Charts: changed LIVE to FRESH
Changed chart text region to indicate data as FRESH (instead of LIVE).
- This distinguishes from confusion with the LIVE term used with running regressions.
3. bugfix Improved shared pages
Various bug fixes when displaying Shared Simscope Pages.
1.436
1. feature Shared Page titles
Shared Simscope Pages can now optionally be saved with a custom title at the top.
For example, this shared page has a custom title Daily Regressions:
2. feature Embedded charts with custom title
When embedding charts, they can now have an optional chart title at the top.
3. bugfix Pie chart series clipping
Pie charts now have clipping enabled, so that series names will be fit properly into the window, rather than being rendered outside the visible window.
1.435
1. feature Rule Templates with Regex Branches
Rule Templates now can have a
regular expression branch (e.g. dev|main), to support multiple branches with a single template.
- When the template expands into a signature rule, it will be converted to a fixed branch (e.g.
main).
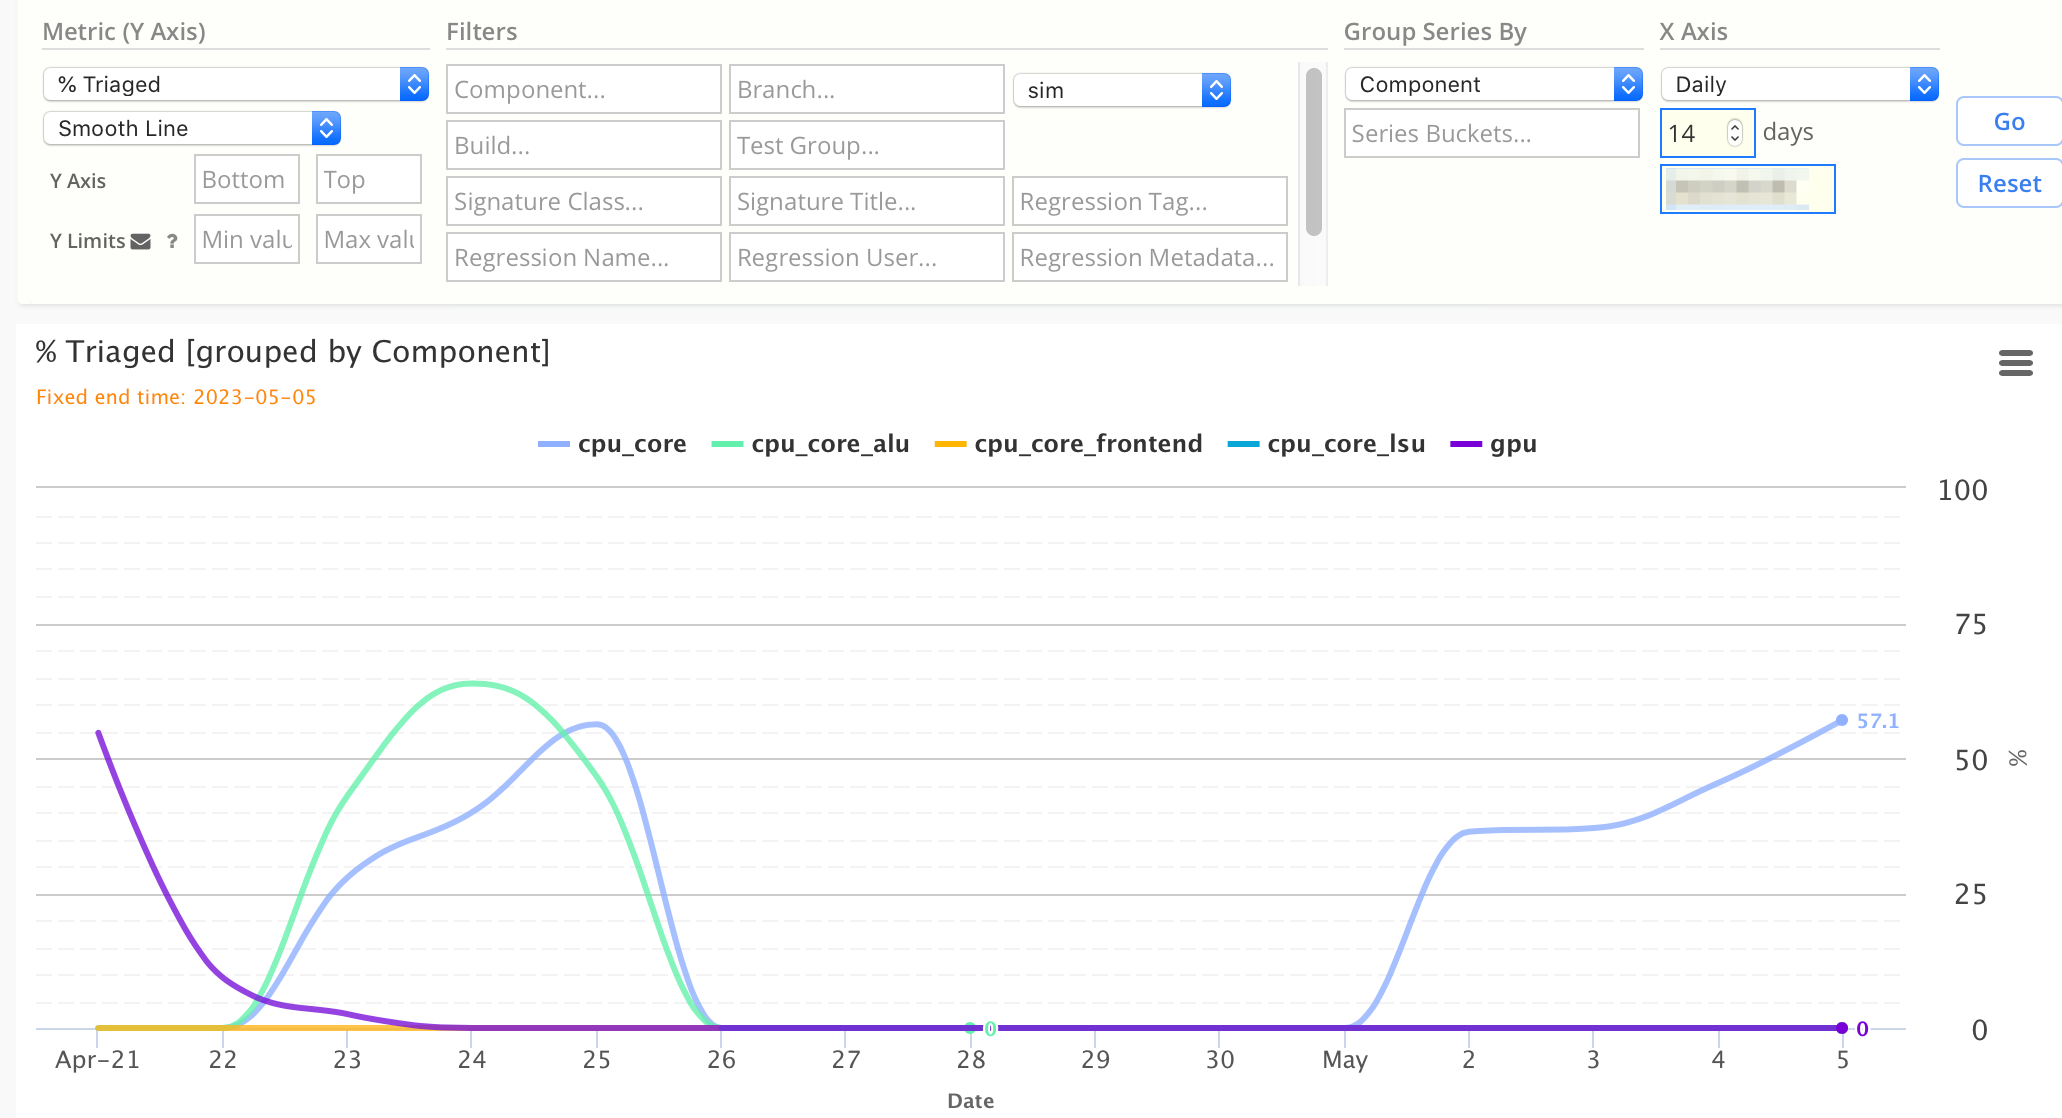
2. feature Triage rates in Metric charts
Metric charts now support charting triage rates. Here is an example line chart:
3. bugfix Job Metadata with commas now supported
Custom Job Metadata now supports metadata values with comma (ie ,)
characters embedded in them.
Note: this metadata feature requires the latest Tunnel release to work.
4. bugfix Disable skip signatures after enabling skip signatures
SIMSCOPE-64
In previous Simscope versions, if Skip signatures were enabled and then disabled, Simscope would get confused and incorrectly mark future Pass jobs as Skip jobs.
→ This bug is now fixed.
5. feature Raw job timestamp JSON display mode
When viewing job JSON files from the web interface, Simscope now shows full start/finish timestamps (with microseconds), to make debugging of aliased jobs easier.
- Normally the timestamps get rounded to second-level precision.
1.434
1. bugfix Regression details bugfix
When filtering signatures within the Regression details page, with a category filter (ie lint, sim, etc) set, the job Totals line was incorrectly showing job totals across all categories.
2. bugfix Regression metadata chart grouped by Job Category
When charting regression metrics, if Group By is set to "Job Category", metric charts will render correctly now.
(Note this is an invalid selection, but the chart will still render)
3. bugfix URL encoding of +regressions
Fixed three URL encoding problems, if regressions contained + (plus) characters in the name.
4. feature Exclusive Signature search
When searching Signatures with Exclusive Signatures checked, Simscope will now show a filter indicator at the top of the page.
1.433
1. feature Regression time_limit_hours
SIMSCOPE-61
Added Regression JSON time_limit_hours field.
- This is an optional floating point field, which is a per-regression wallclock time limit, in hours.
If set, this enables a custom time limit for individual regressions, where you either want a short or long time limit. If the time limit value is exceeded, Simscope will automatically mark the regression as complete.
For example, you can set time_limit_hours to:
0.5– regression must complete in a half hour.192– regression must complete within 8 days.
If the time_limit_hours value is either zero, or not set, Simscope will use the default
autotimeouthours instead.
2. feature Added fieldcolor configuration
Regression fields can now be colorized in the
Regression Metadata Dashboard using the fieldcolor
configuration.
- For example, you can use this to make fields change color between green or red (good or bad values).
1.432
bugfix Allow + character in regression name
In previous versions, links to some regression results would not be encoded properly
if the regression name contained a + character (e.g. myregr+1234).
This bug is now fixed.
1.431
1. feature Test List table default metadata columns
The Test List table now supports default metadata columns, if you add this to your
simscope.config file:
[tests]
# Add the user column to Test List Search
testlistautometadata = "user"

# To add multiple columns, separate by a comma
# testlistautometadata = "user,cycles"
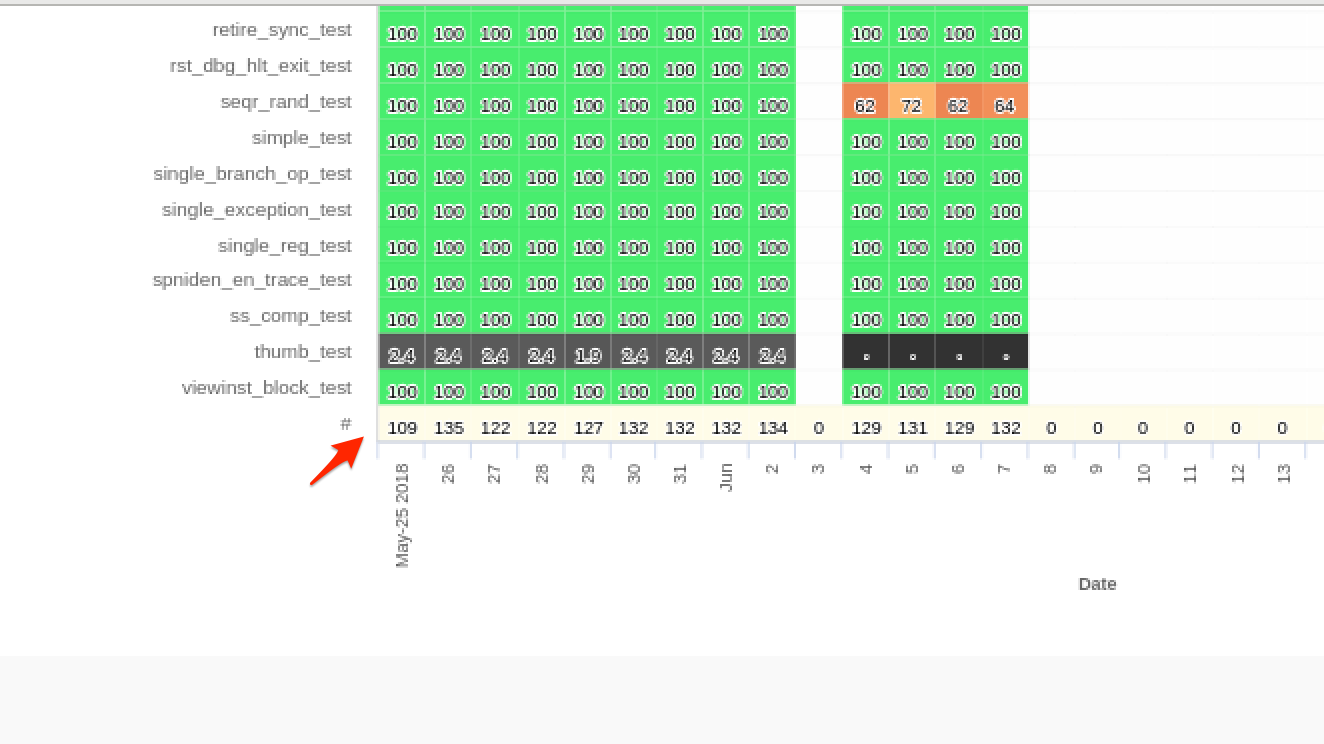
2. feature Added Column count row on Heatmap charts
Heatmap charts now render a # (Column Count), to indicate how many unique series matched in
each column.
3. feature Standalone message bucketizer
Simscope can now be run standalone, to bucketize job messages from the command line.
This does not affect Simscope server performance, as the logic is run client side.
Example input with 3 job messages.
Notes:
- The input format is a
JSONstring array. Simscope discards anything after the first line. - The first message has a
<<keep>section. - The second message has an
{{ignore}}section. - Third job is a pass (blank message).
[
    "UVM_ERROR 123 <<my_component>> top index fail",
    "[timestamp 400.2ns] world {{102}}\nsecond line",
    ""
]
To bucketize these on the command-line, run:
> bin/simscope bucketize messages.json > buckets.json
This example will produce buckets.json:
[
    "UVM_ERROR ... <<ignore>> top index fail",
    "timestamp ... world {{102}}",
    "Pass"
]
4. feature Login allow uppercase user ID
Simscope will now allows users to login with uppercase user ID's (Simscope will convert to lowercase automatically).
5. feature Added UNIQUE chart queries
Metric charts can now select UNIQUE group by, to COUNT() unique series hits.
6 bugfix simscope_client strip invalid trailing slash on host address
The Python simscope_client now will strip invalid trailing slashes on host address.
7. bugfix Workaround Python JIRA package older versions
The Python jira package now works with older versions, missing the my_permissions value.
Previously, if you ran Simscope JIRA scripts with older versions of the jira package,
you would get an Exception thrown.
Now the code will detect old version, and skip this logic.
8. bugfix Chart chart color palette
Improved the chart color palette from ~11 colors to ~35 colors, to improve rendering charts with many series.
1.430
1. bugfix Job duration increase to 24 days
For groups running very long jobs, the maximum individual job duration in Simscope
(runtime_ms and compute_ms) has been increased from 10 days to 24 days.
- Note: this value is different than regression duration, which is unlimited.
2. bugfix Changed x-axis chart maximum length
The X axis labels (for model version, test group, etc) charts, has been reduced from 24 characters to 20 characters, to improve the chart rendering with long labels.
