Simscope Release History — v310 — 319
1.319
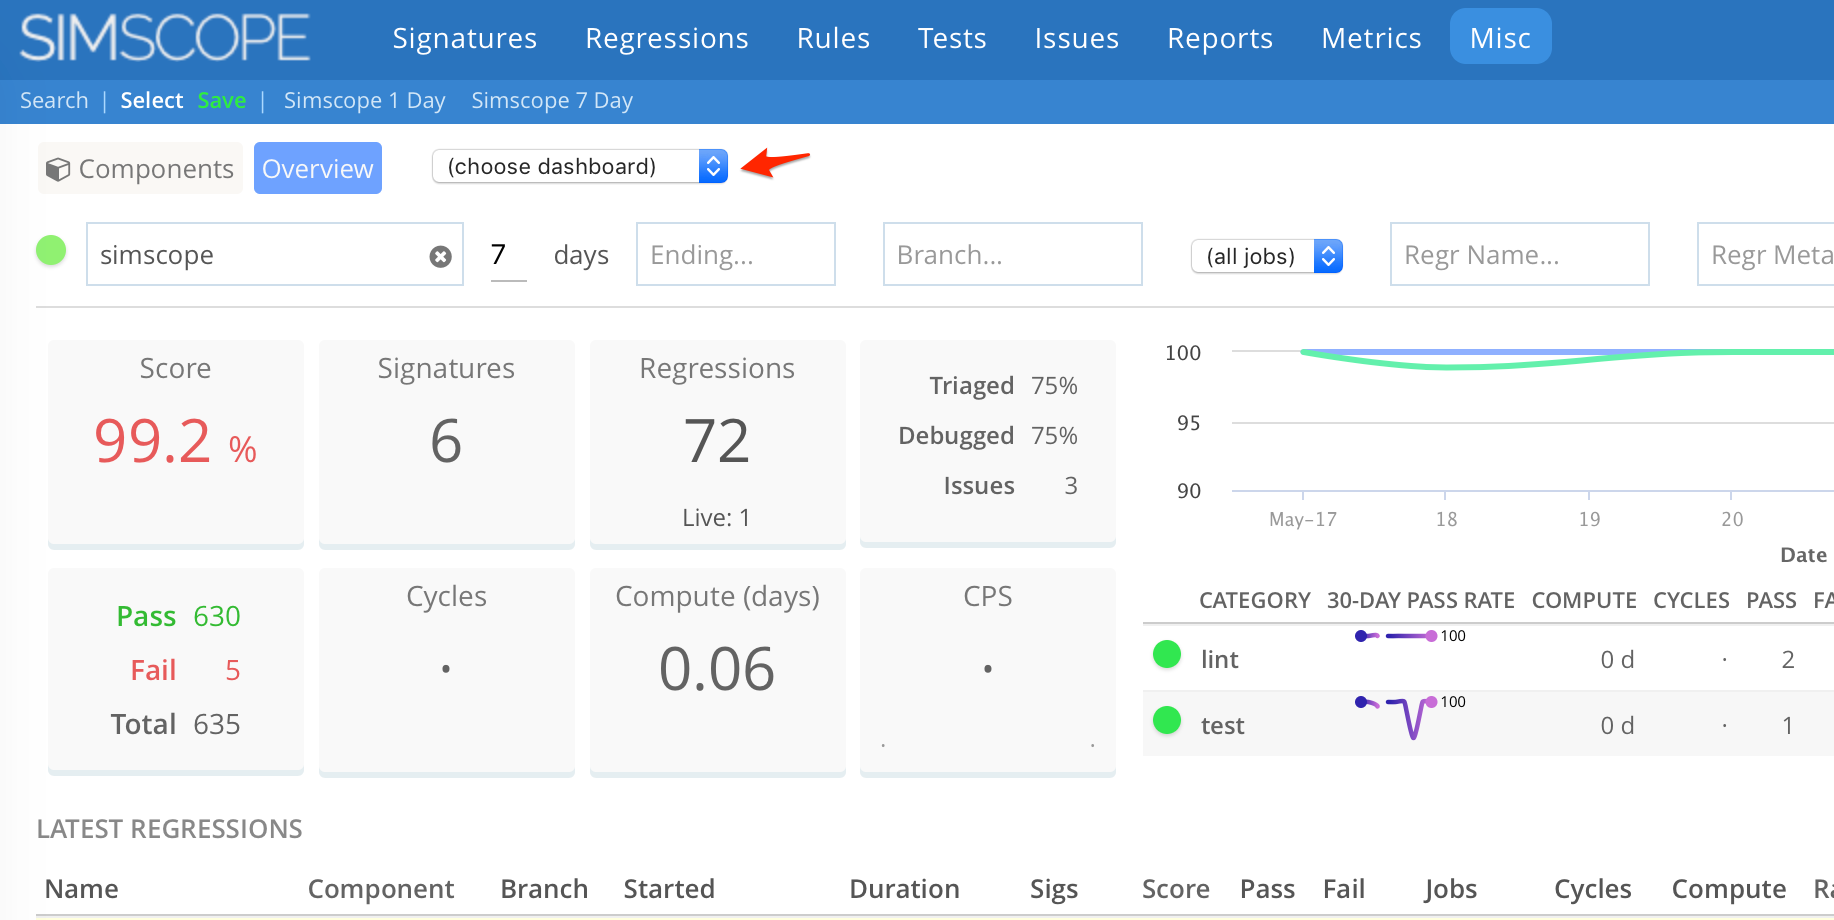
1. feature Component Dashboard Dropdown
The component dashboards are now in a dropdown, to allow many dashboard choices on the screen.
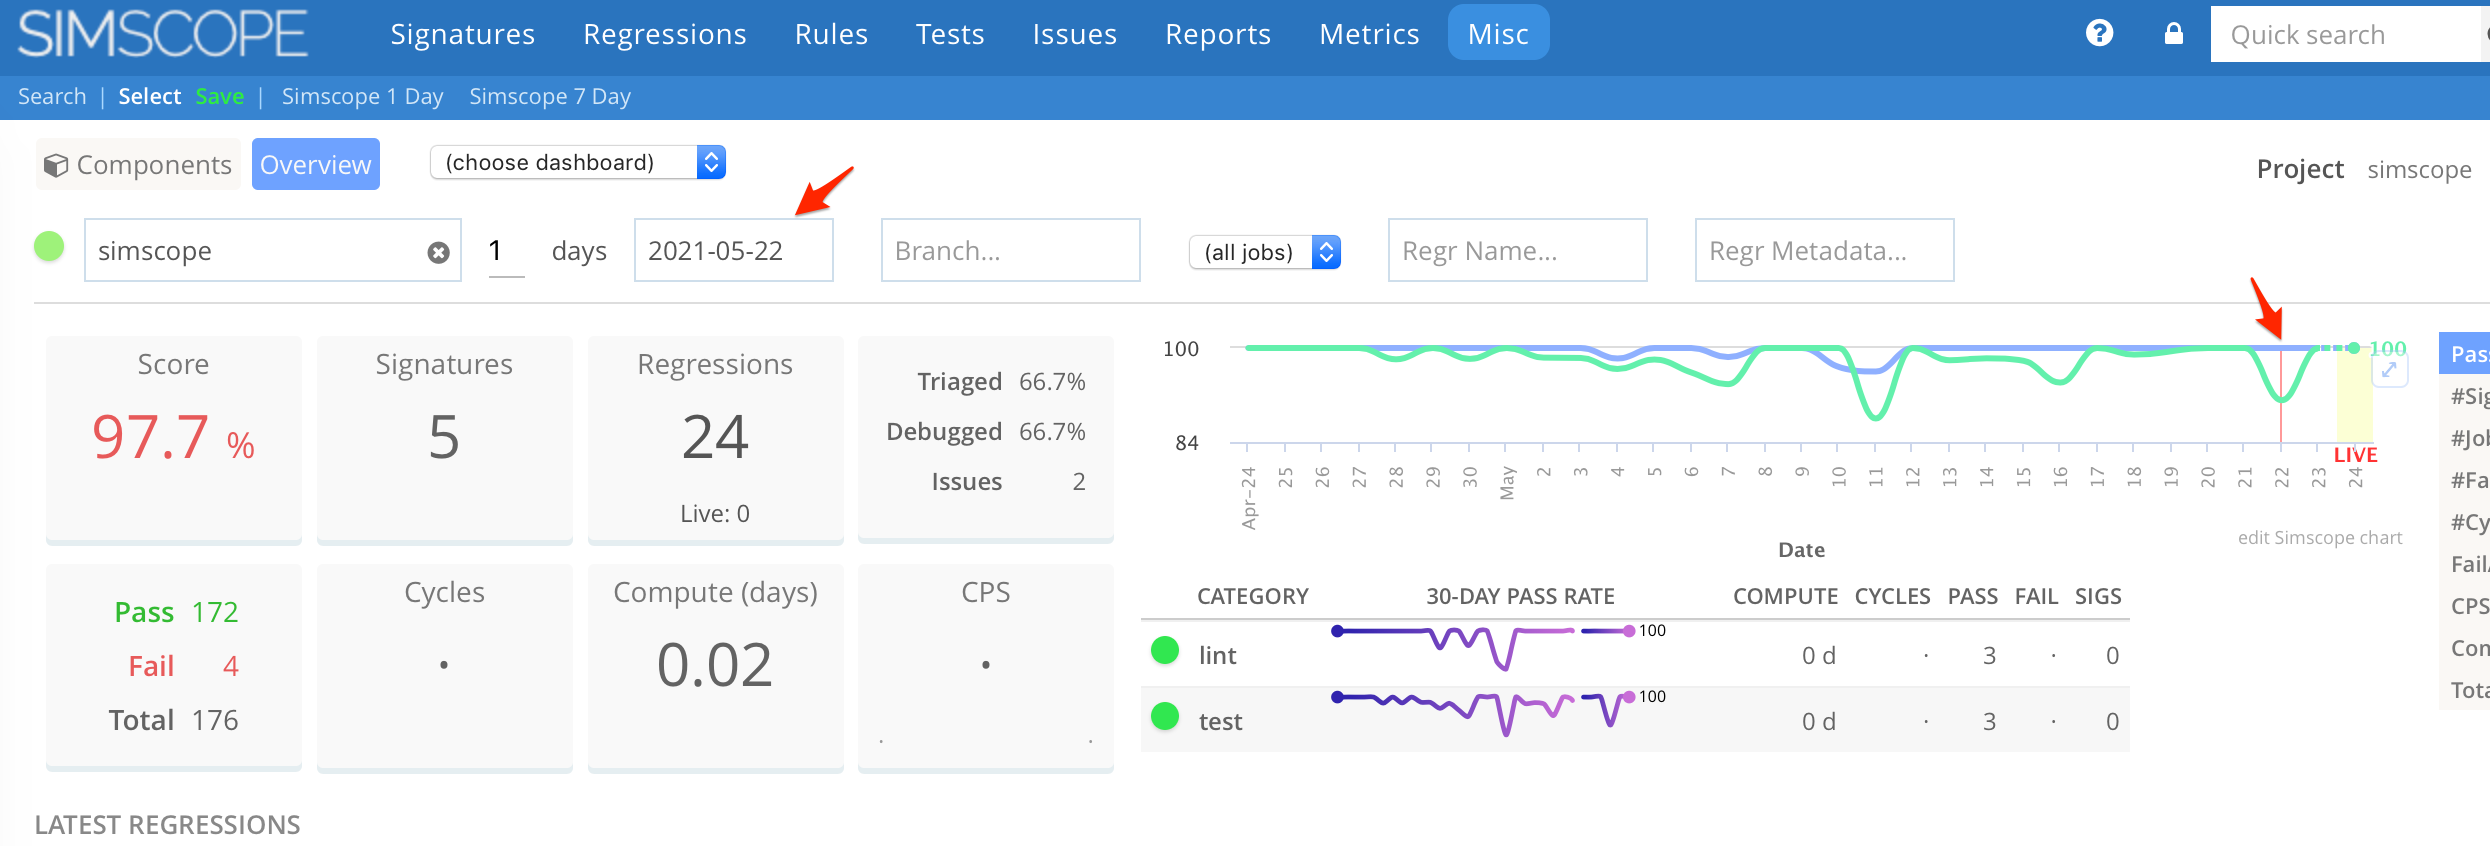
2. feature Dashboard Date Marker
When showing a specific date on the component dashboard (or home page), Simscope will show a red bar marker indicating the date.
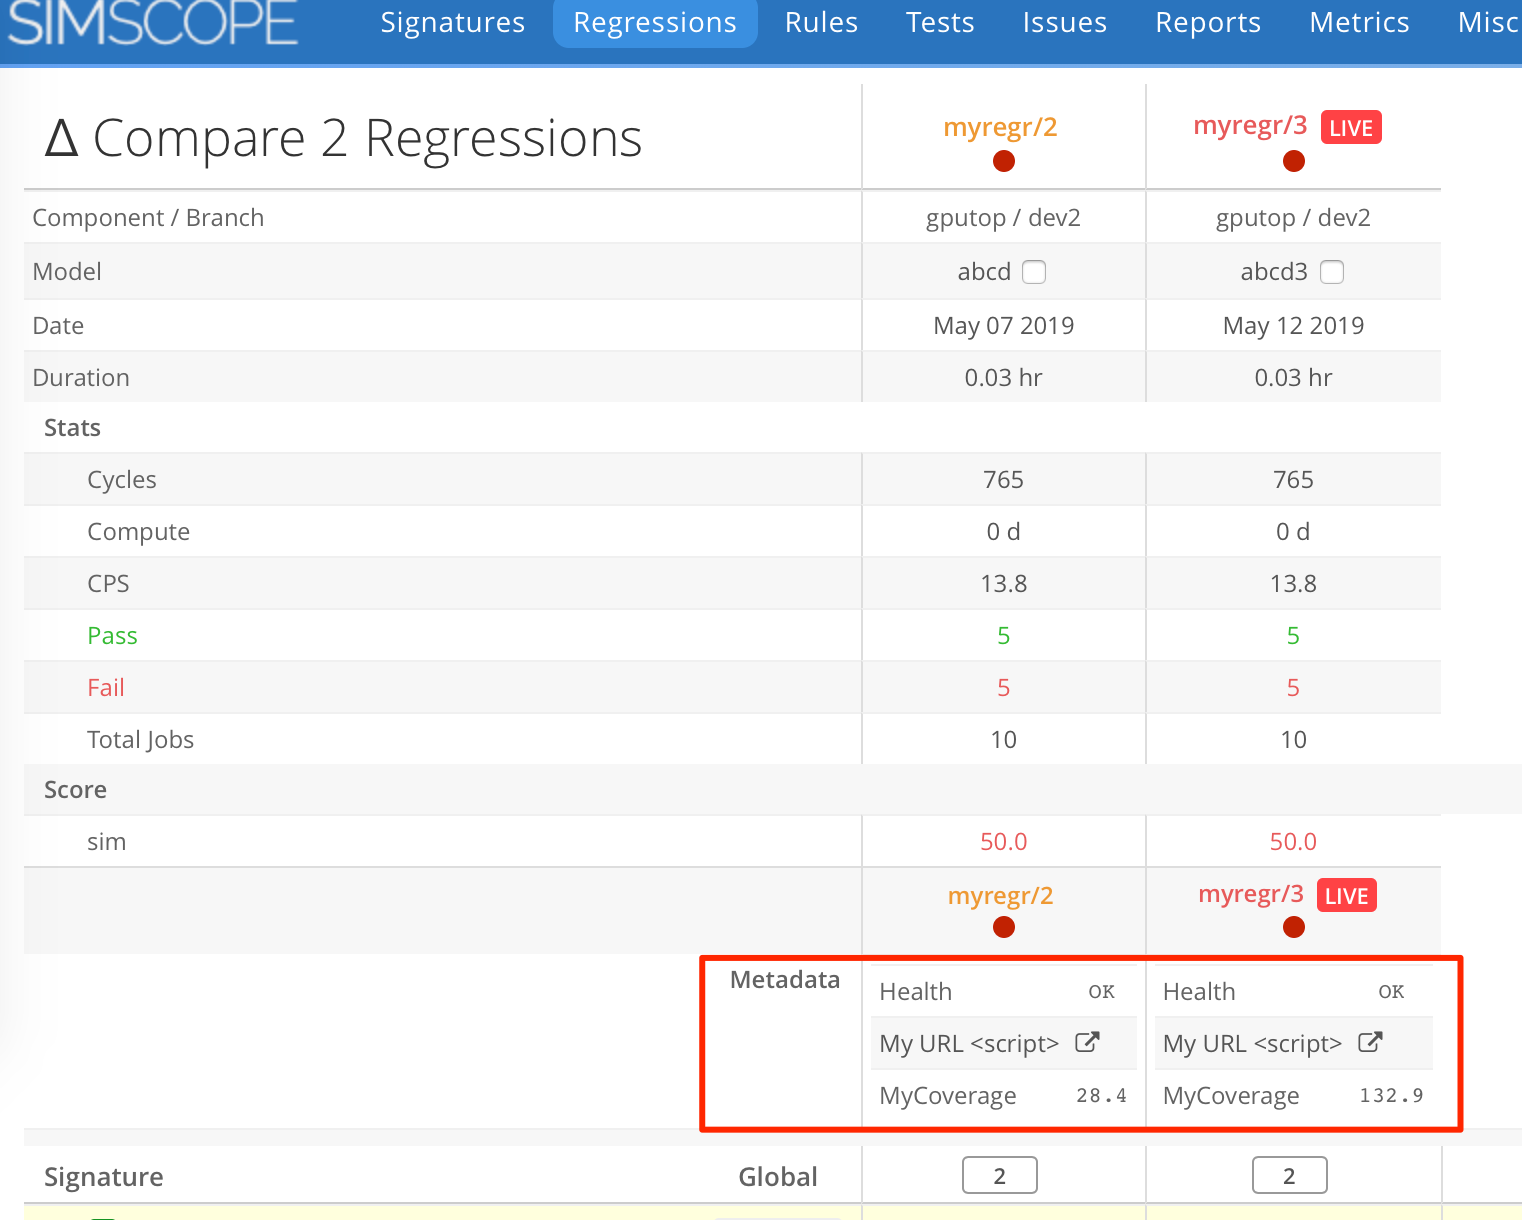
3. feature Regression Metadata Diff
When comparing regressions, metadata are now shown.
4. bugfix JIRA update without email address
The simscope-jira-update.py script now works for bugs where the assignee
does not have an emailAddress attribute.
1.318
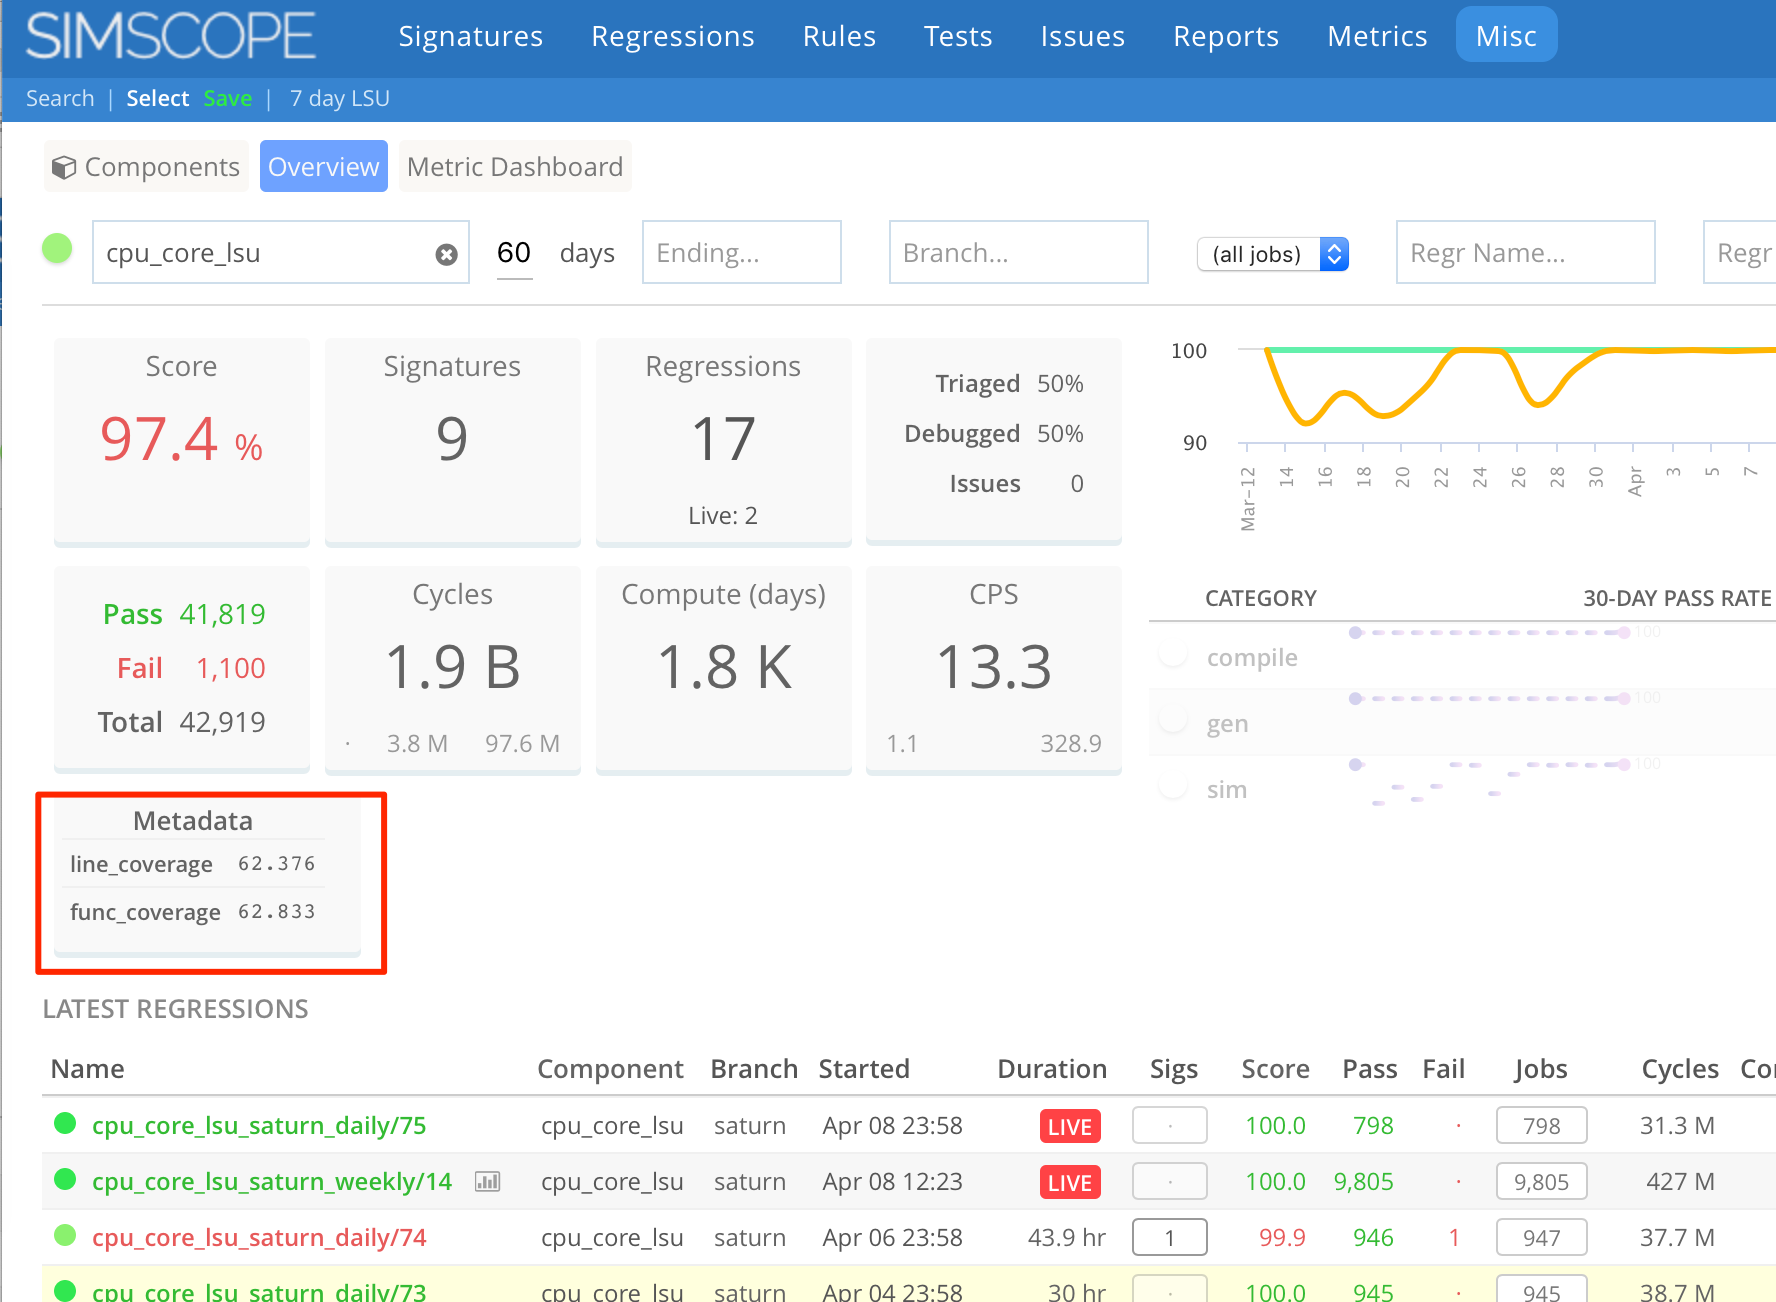
1. feature Component Dashboard Metadata widget
In the component dashboard, Simscope will display the latest regression's metadata.
For example, if a coverage regression was run, this will show the latest coverage results.
Here is an example showing coverage:
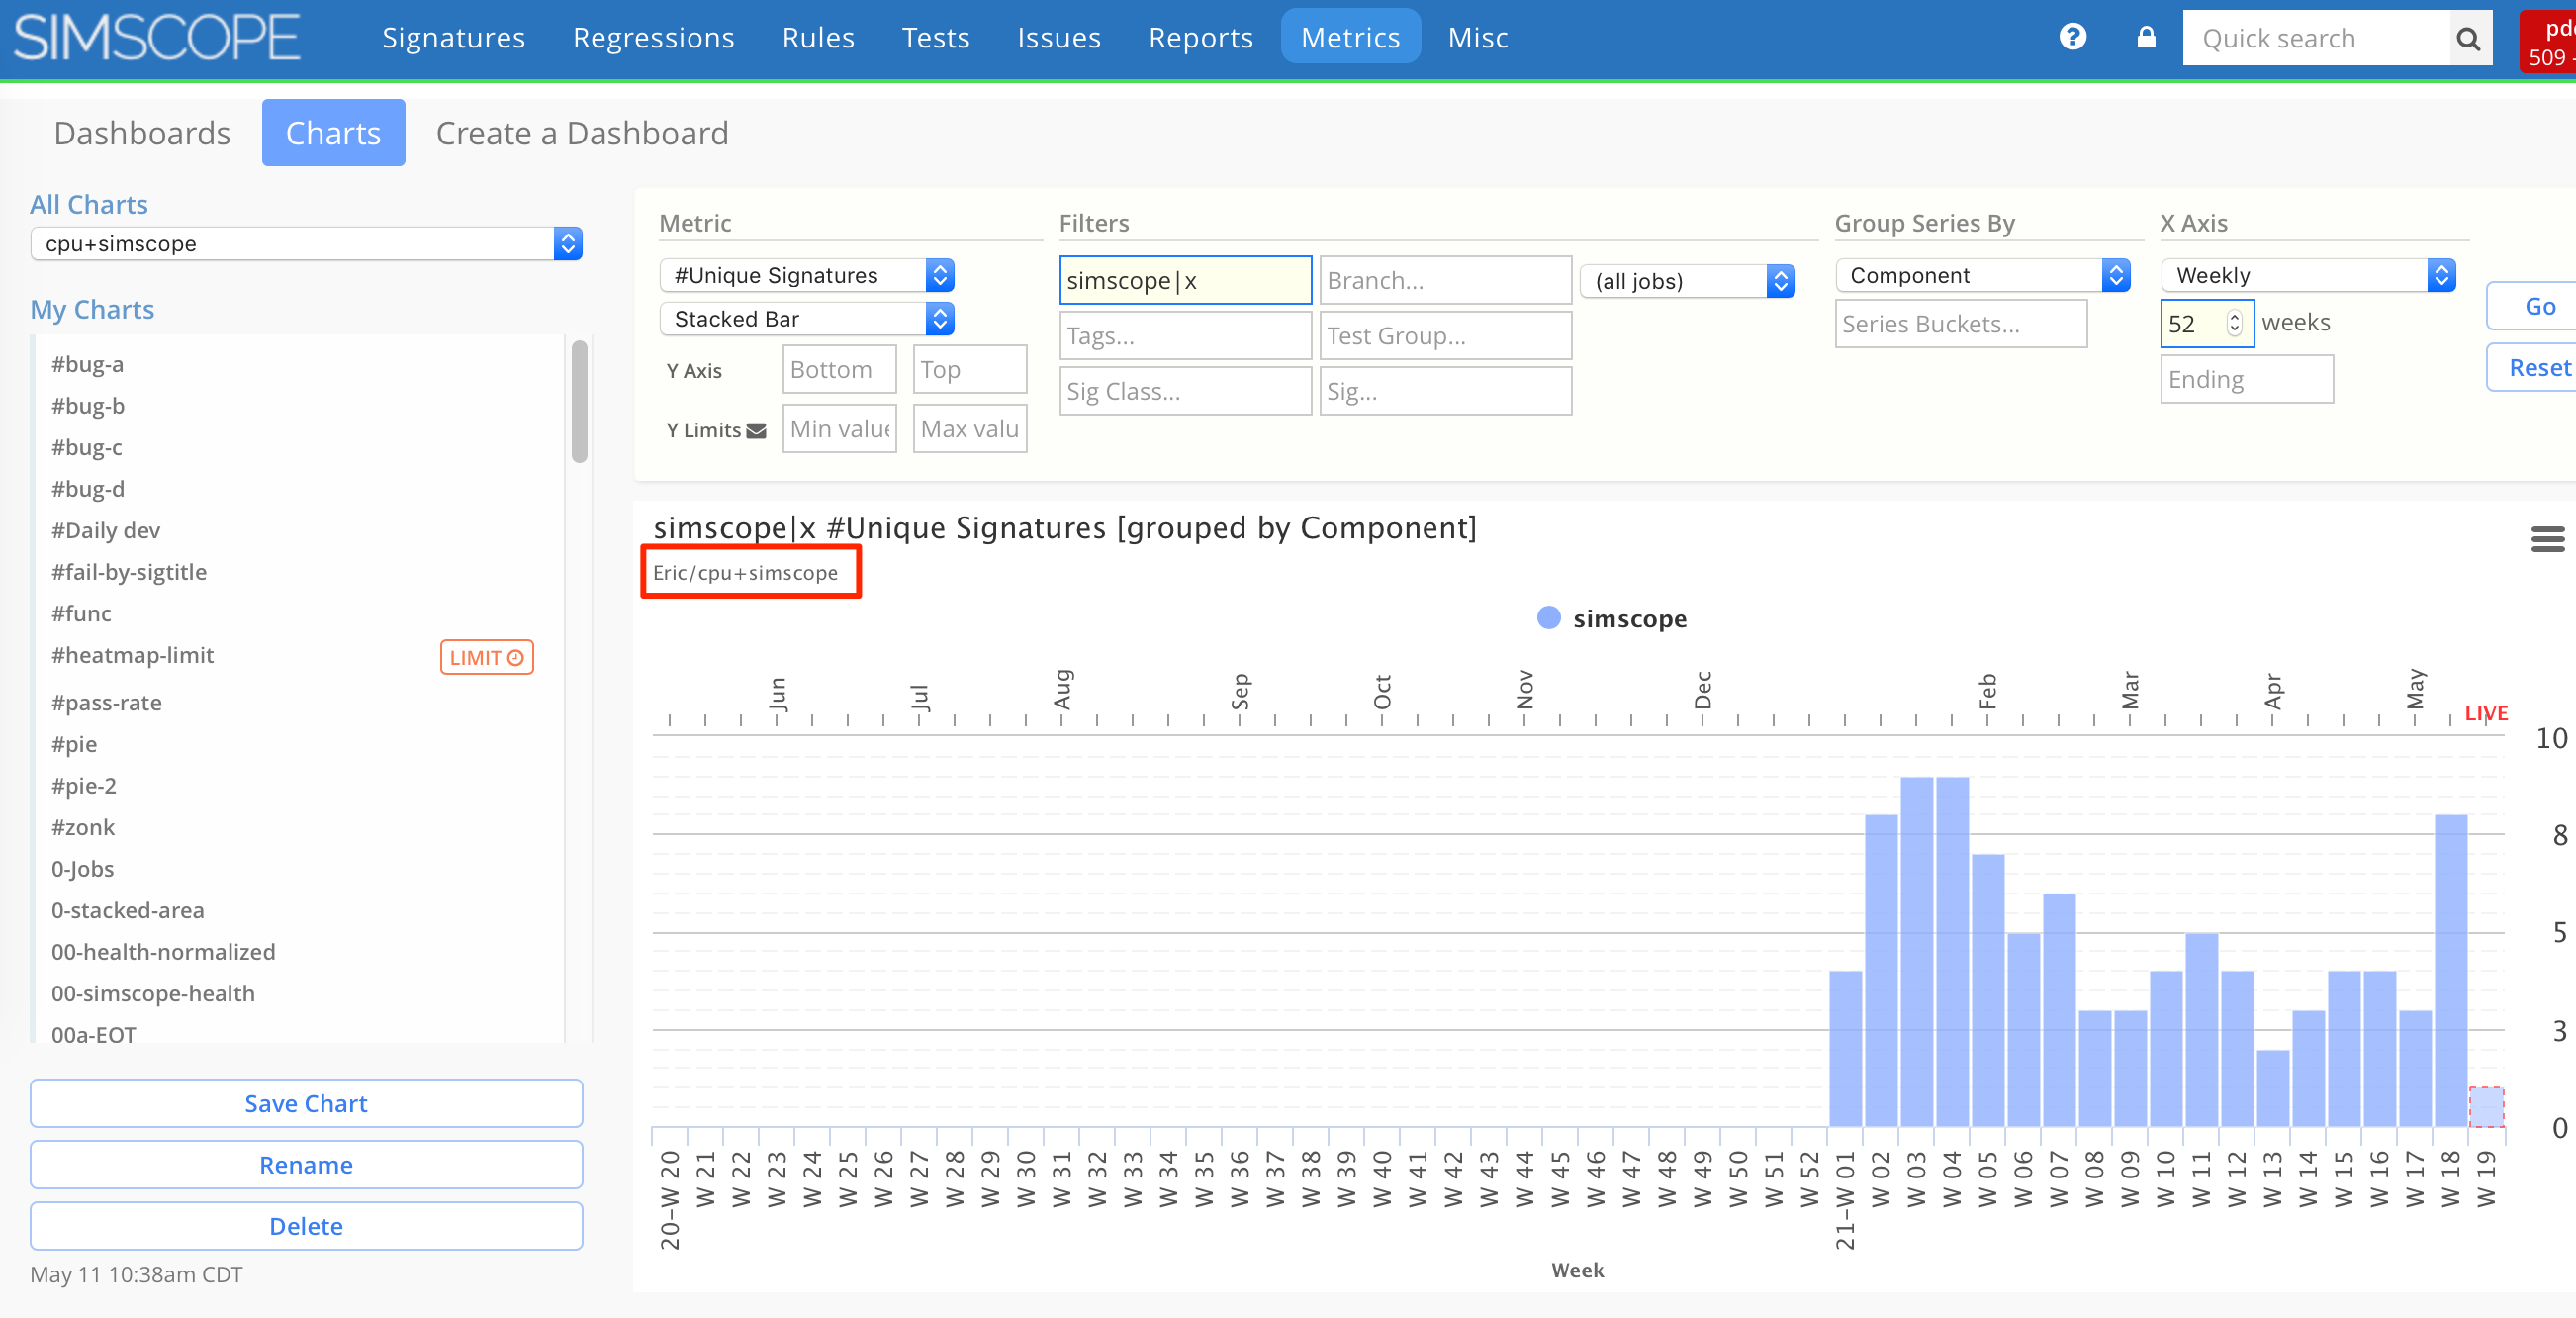
2. feature Saved Charts now show owner indicators
When viewing/editing other user's charts, Simscope now shows the saved chart owner/name.
1.317
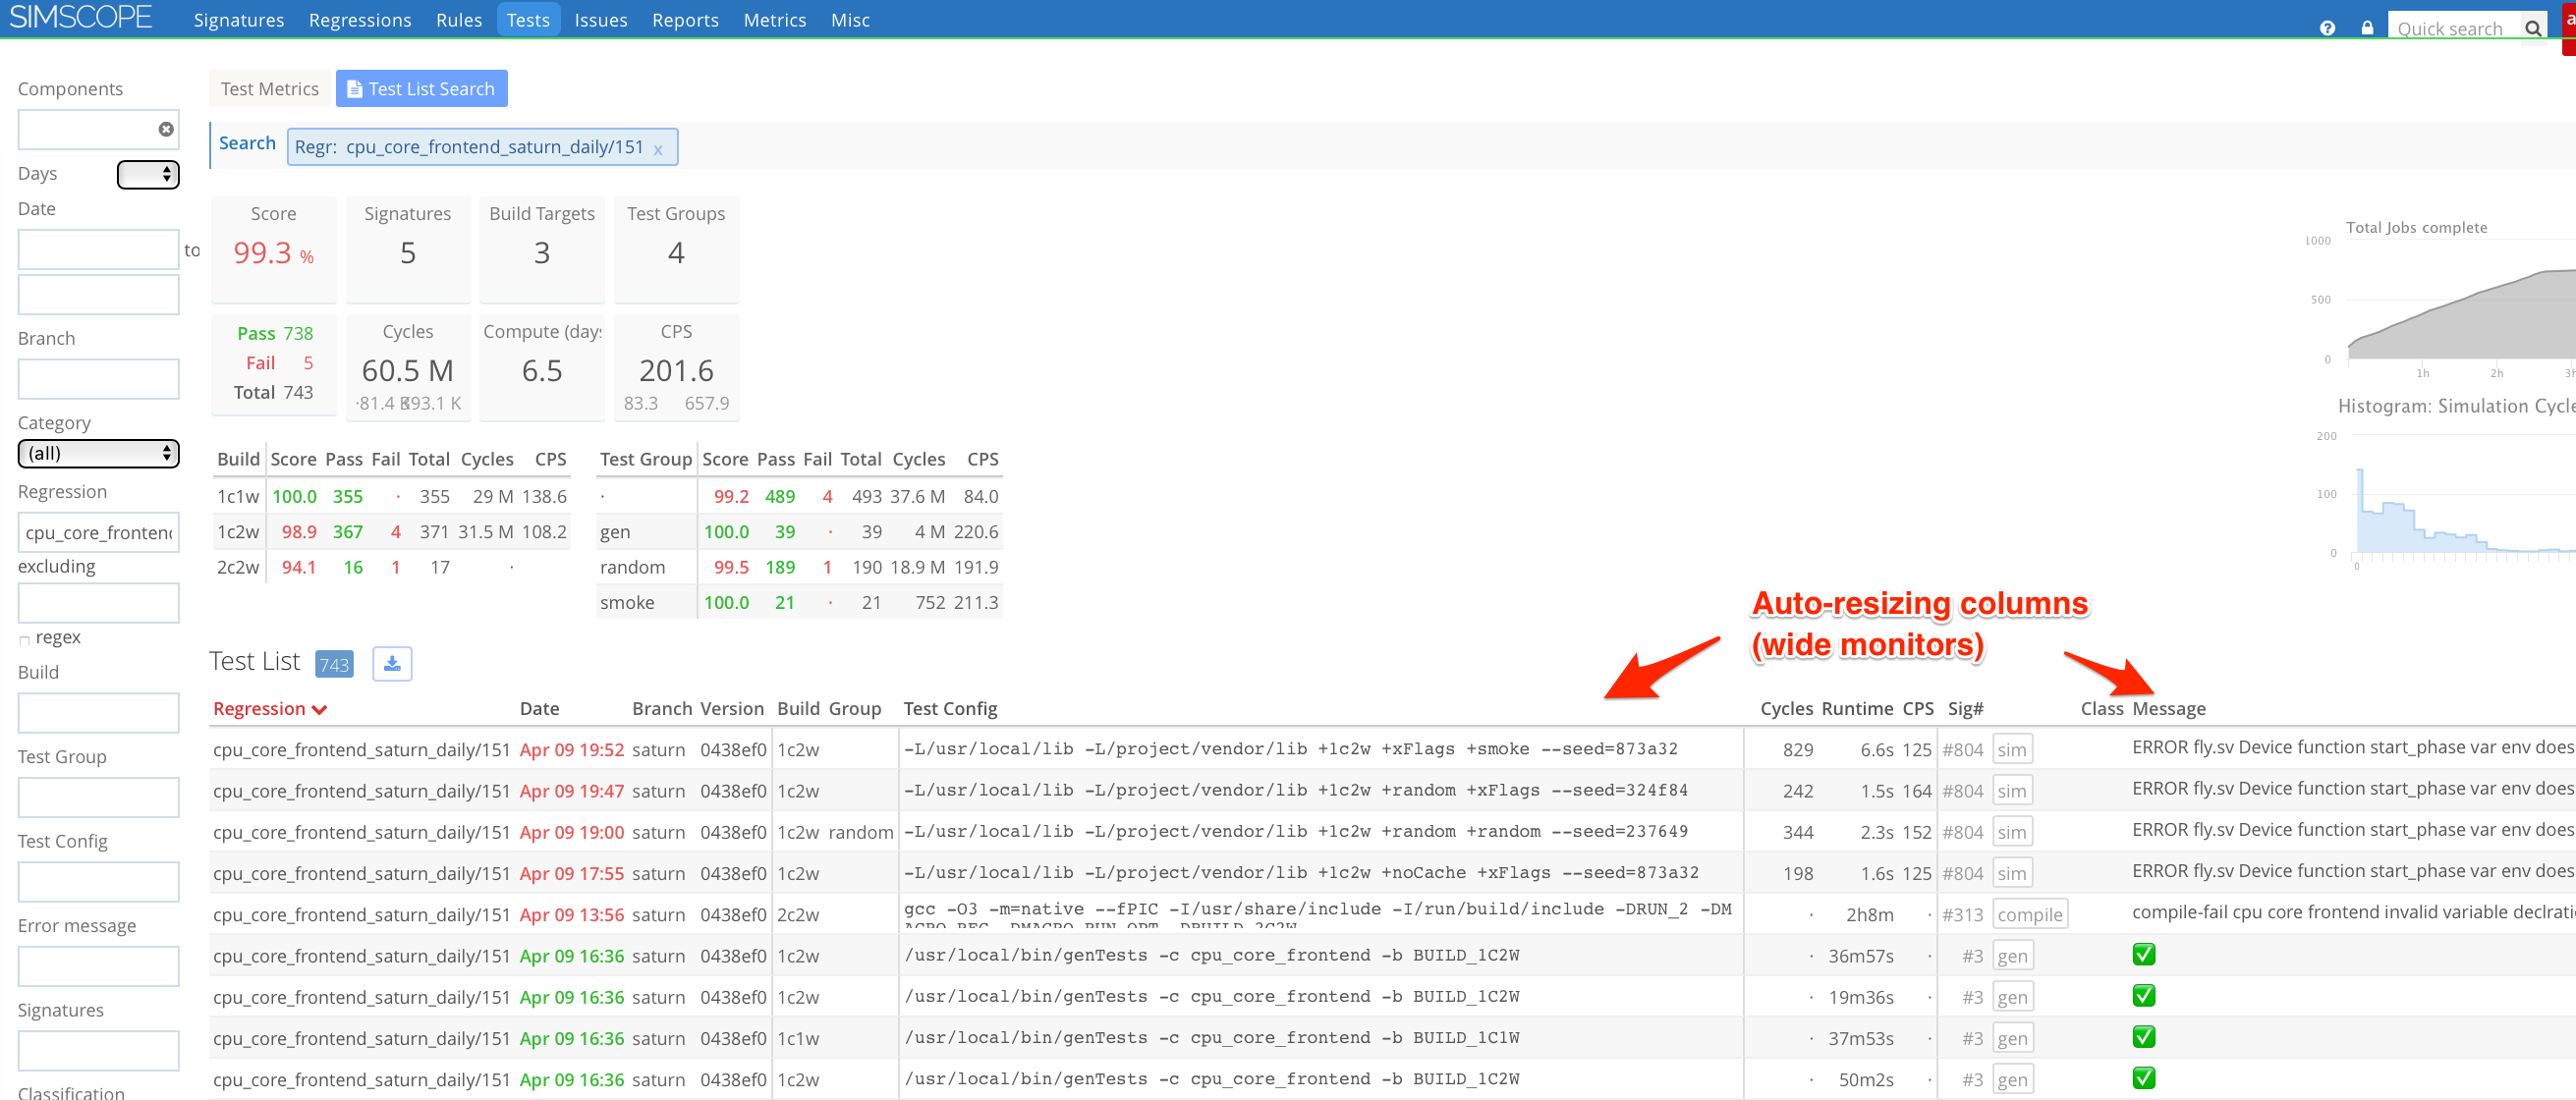
1. feature Test search table resizing
The test search table now automatically expands for large monitors.
2. bugfix Chromium bug with Rule button
The prior version had a bug where the [+] Rule button (on the Signatures page)
would render incorrectly.
3. bugfix Job duplicate detector now inspects seed field
The duplicate detector now automatically takes the seed field into account.
4. feature RabbitMQ Message replies (debugging)
This version has a new feature to improve debugging, where either invalid messages (or all messages) can be sent to a RabbitMQ queue, for later inspection.
This enables debugging regression script errors found in Simscope, even hours later after the regression has run.
Note: messages replies requires the Tunnel version 1.27 or higher.
1.316
1. feature Simscope regression finish JSON
Simscope now can optionally accept a JSON regression metadata update during the
regr-finish event
If you don't want to change regression metadata, leave the message body blank.
2. bugfix Javascript bug fixes
The prior Simscope version had a few minor Javascript issues in chart limits on heatmap charts.
1.315
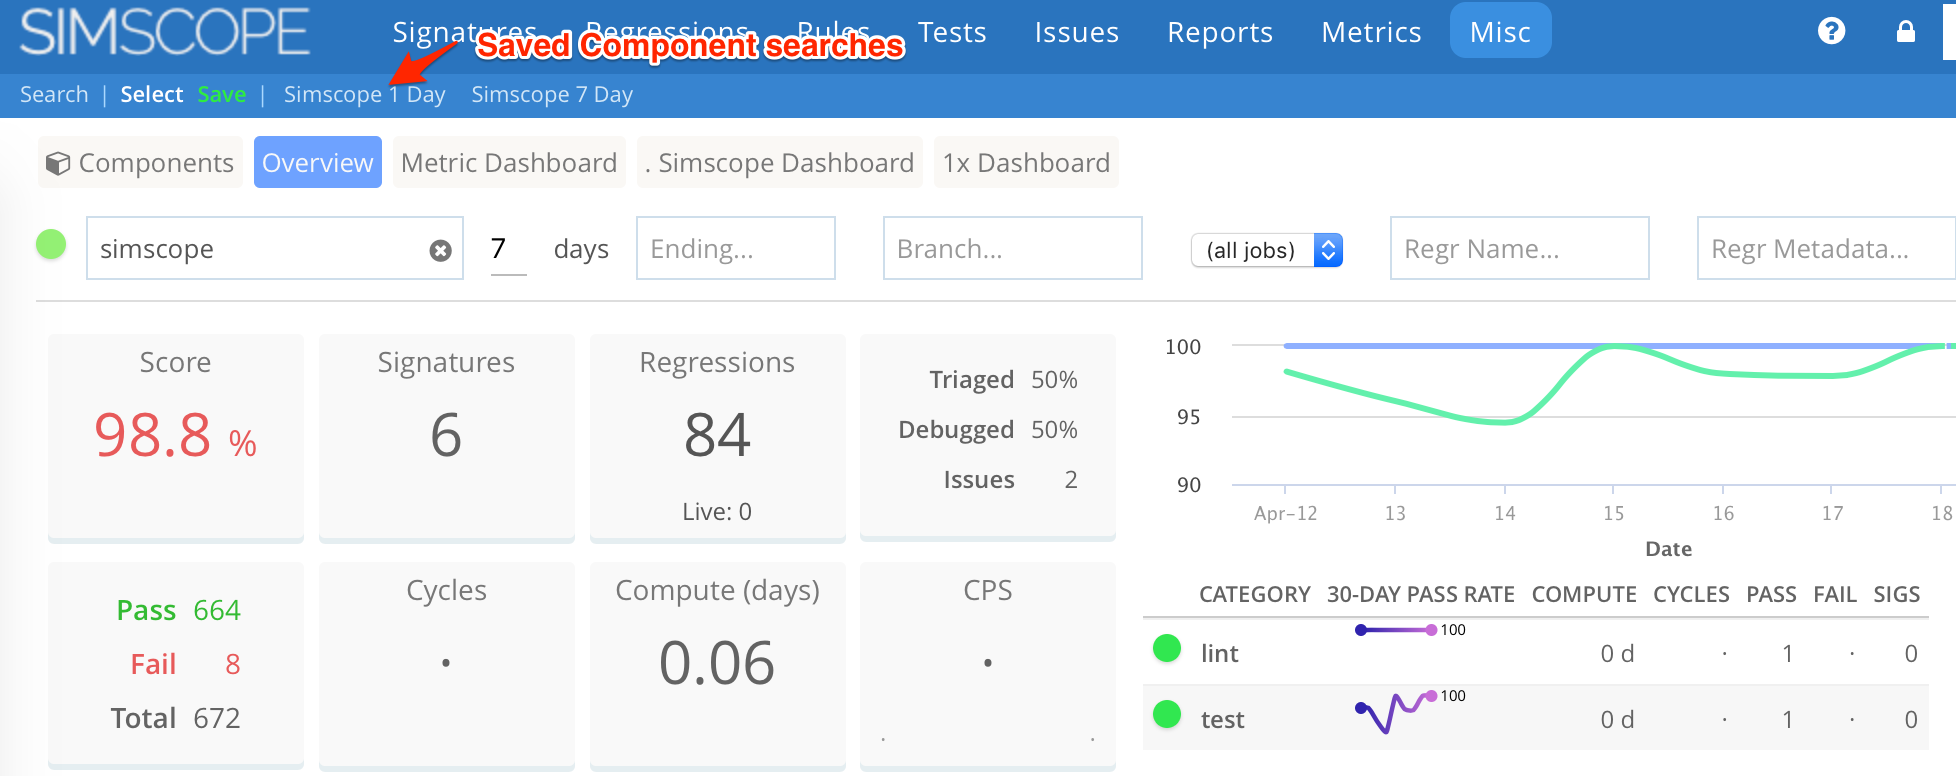
1. feature Saved component search
Component search configurations can now be saved and restored.
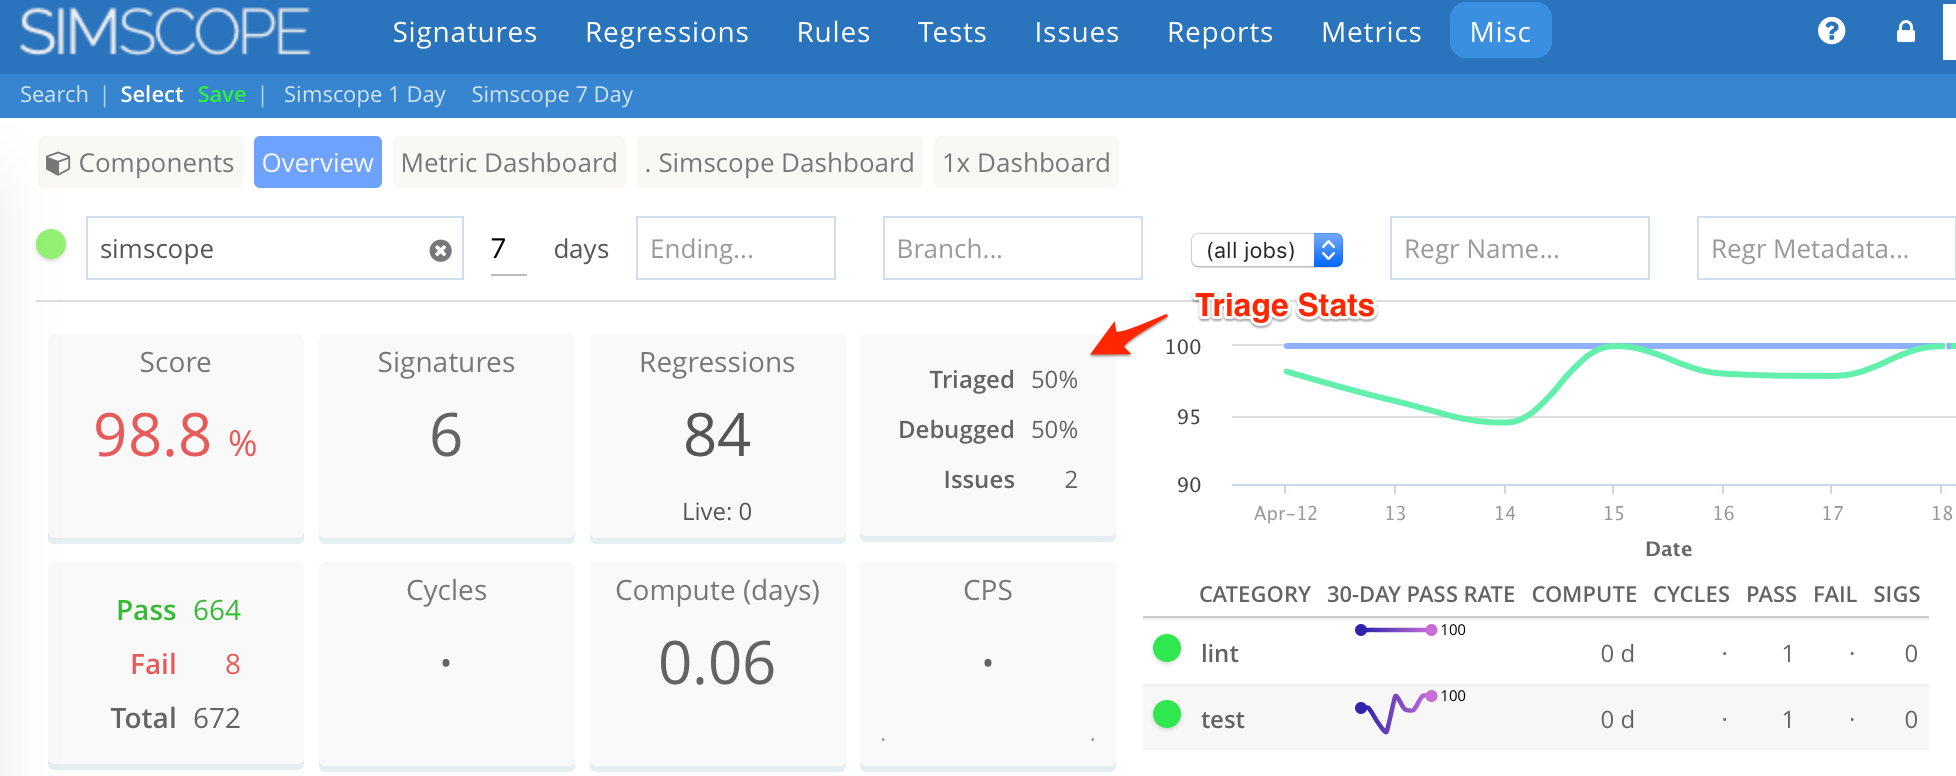
2. feature Triage stats
The home page and component pages now show basic Triage stats.
3. feature Admin Error log link
You can now click the Error Log to view the log in a full window, for easier searching and downloading.
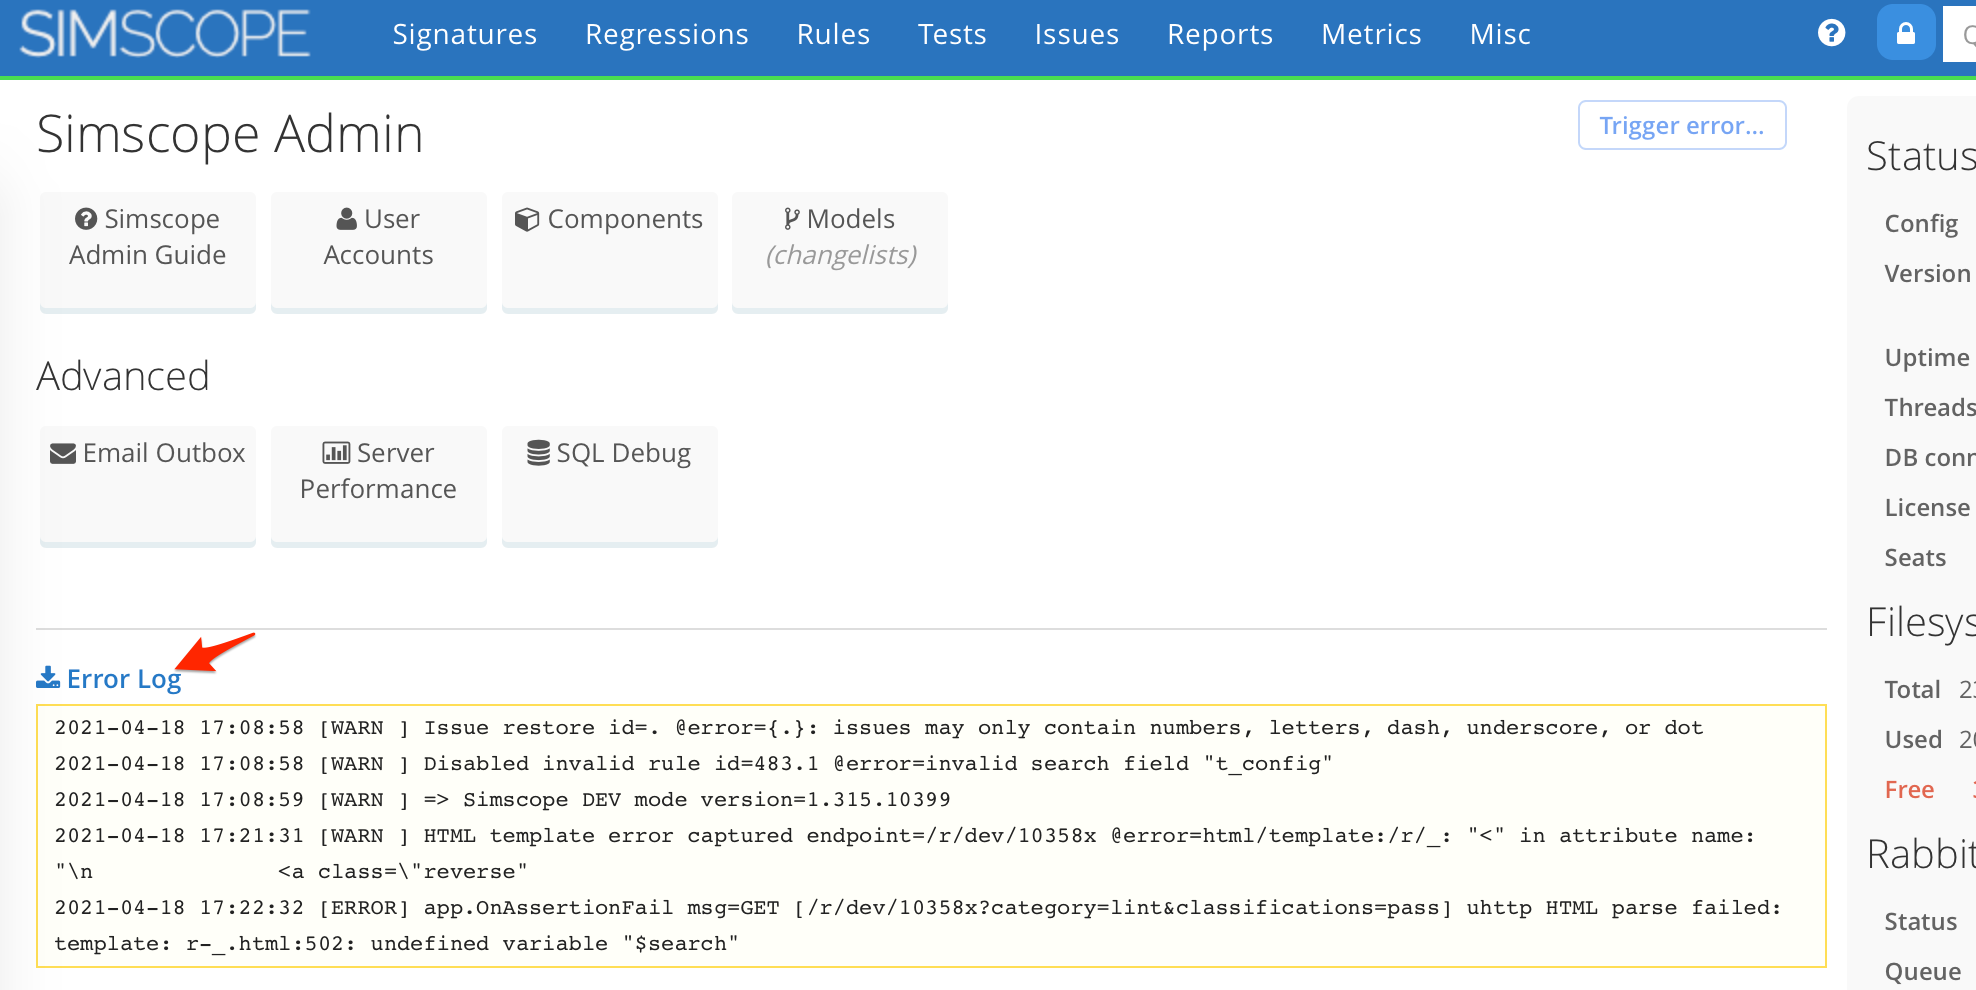
→ This will open a browser window similar to the following:
2021-04-18 17:08:58 [WARN ] Issue restore id=. @error={.}: issues may only contain numbers, letters, dash, underscore, or dot
2021-04-18 17:08:58 [WARN ] Disabled invalid rule id=483.1 @error=invalid search field "t_config"
2021-04-18 17:21:31 [WARN ] HTML template error captured endpoint=/r/dev/10358x @error=html/template:/r/_: "<" in attribute name: "\n              <a class=\"reverse"
2021-04-18 17:22:32 [ERROR] app.OnAssertionFail msg=GET [/r/dev/10358x?category=lint&classifications=pass] uhttp HTML parse failed: template: r-_.html:502: undefined variable "$search"
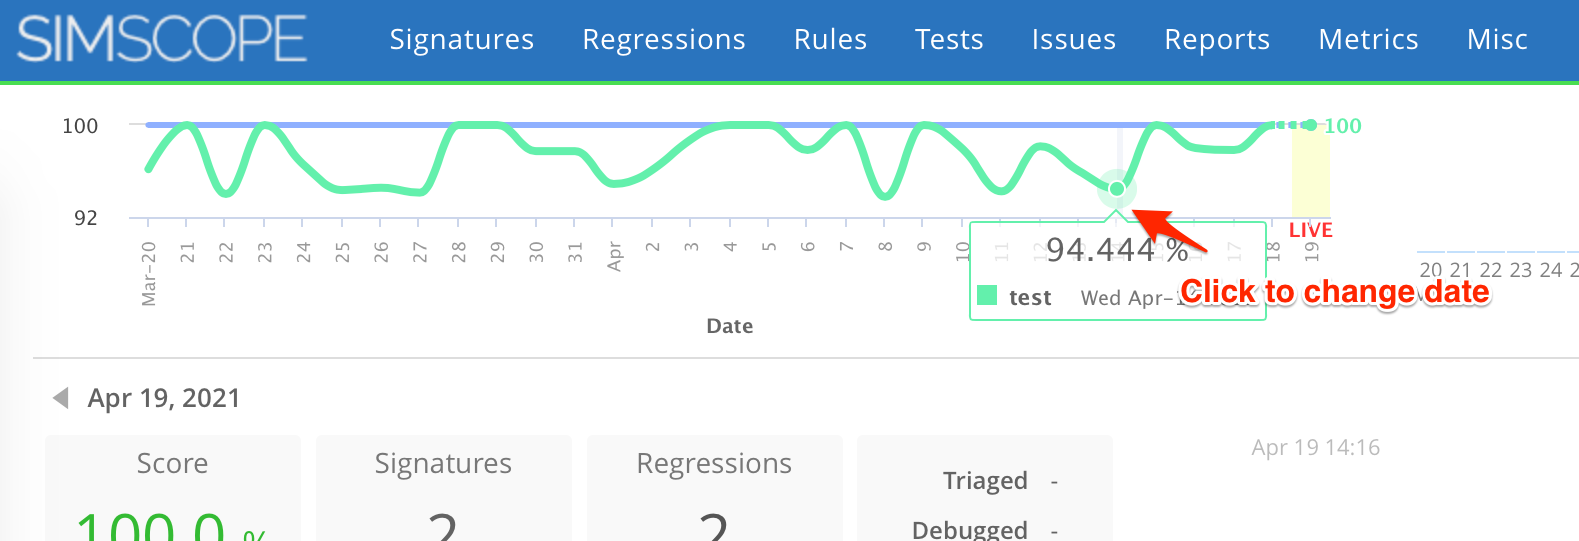
4. feature Click homepage chart to change date
Clicking on a point will change the home page date.
5. bugfix Detect unsupported regex
Simscope will now detect unsupported regular expressions and give the user an error message.
For example:
(!foo|bar)
This should be written as:
!(foo|bar)
1.314
1. feature Add Rule only shows up for untriaged signatures
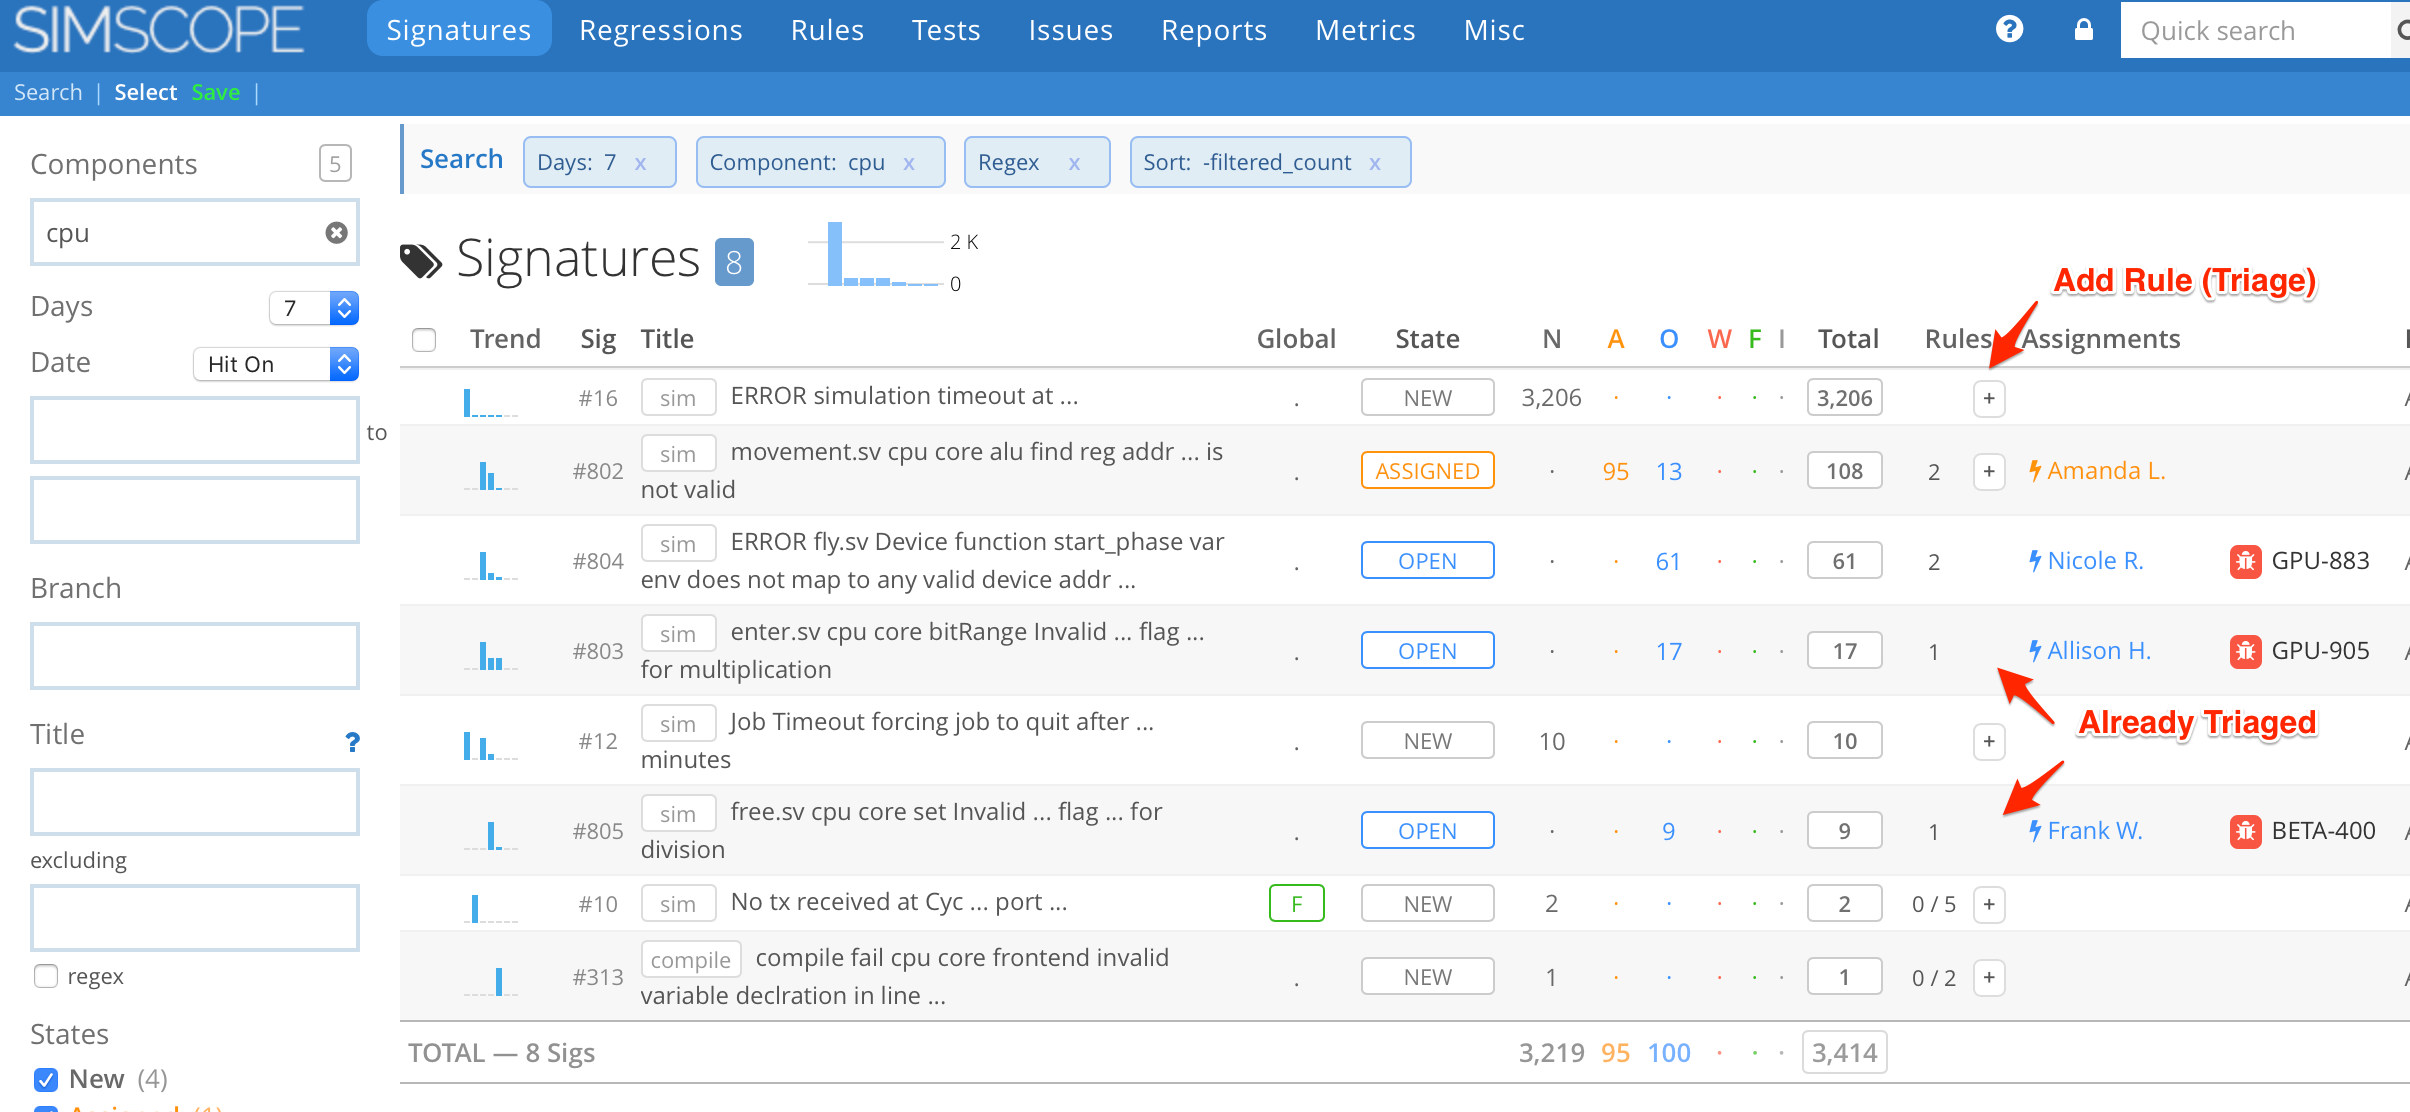
This prevents users from trying to triage a signature that already has a rule and bug on it.
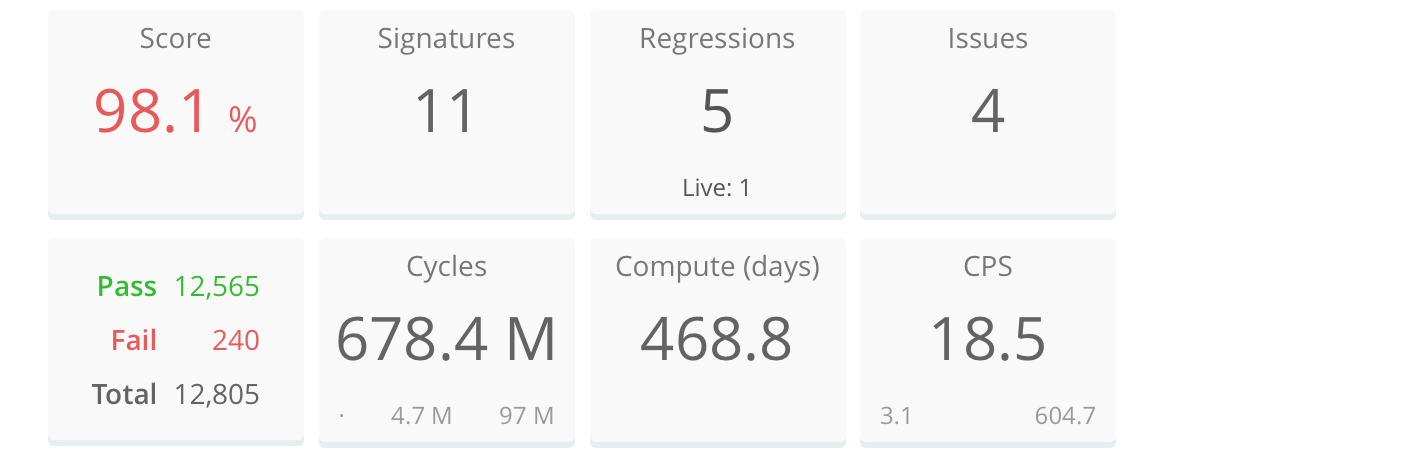
2. feature Component Dashboard tiles
The Component dashboard tiles now includes new tiles:
- Number of Issues
- CPS
3. bugfix Drilldown with Regression metadata not working
The component dashboard can now drilldown properly if either regression name or metadata filters are set.
4. bugfix Editing rules now preserves bug
When editing rules, the popup box now restores the prior bug # (if the rule had one).
1.313
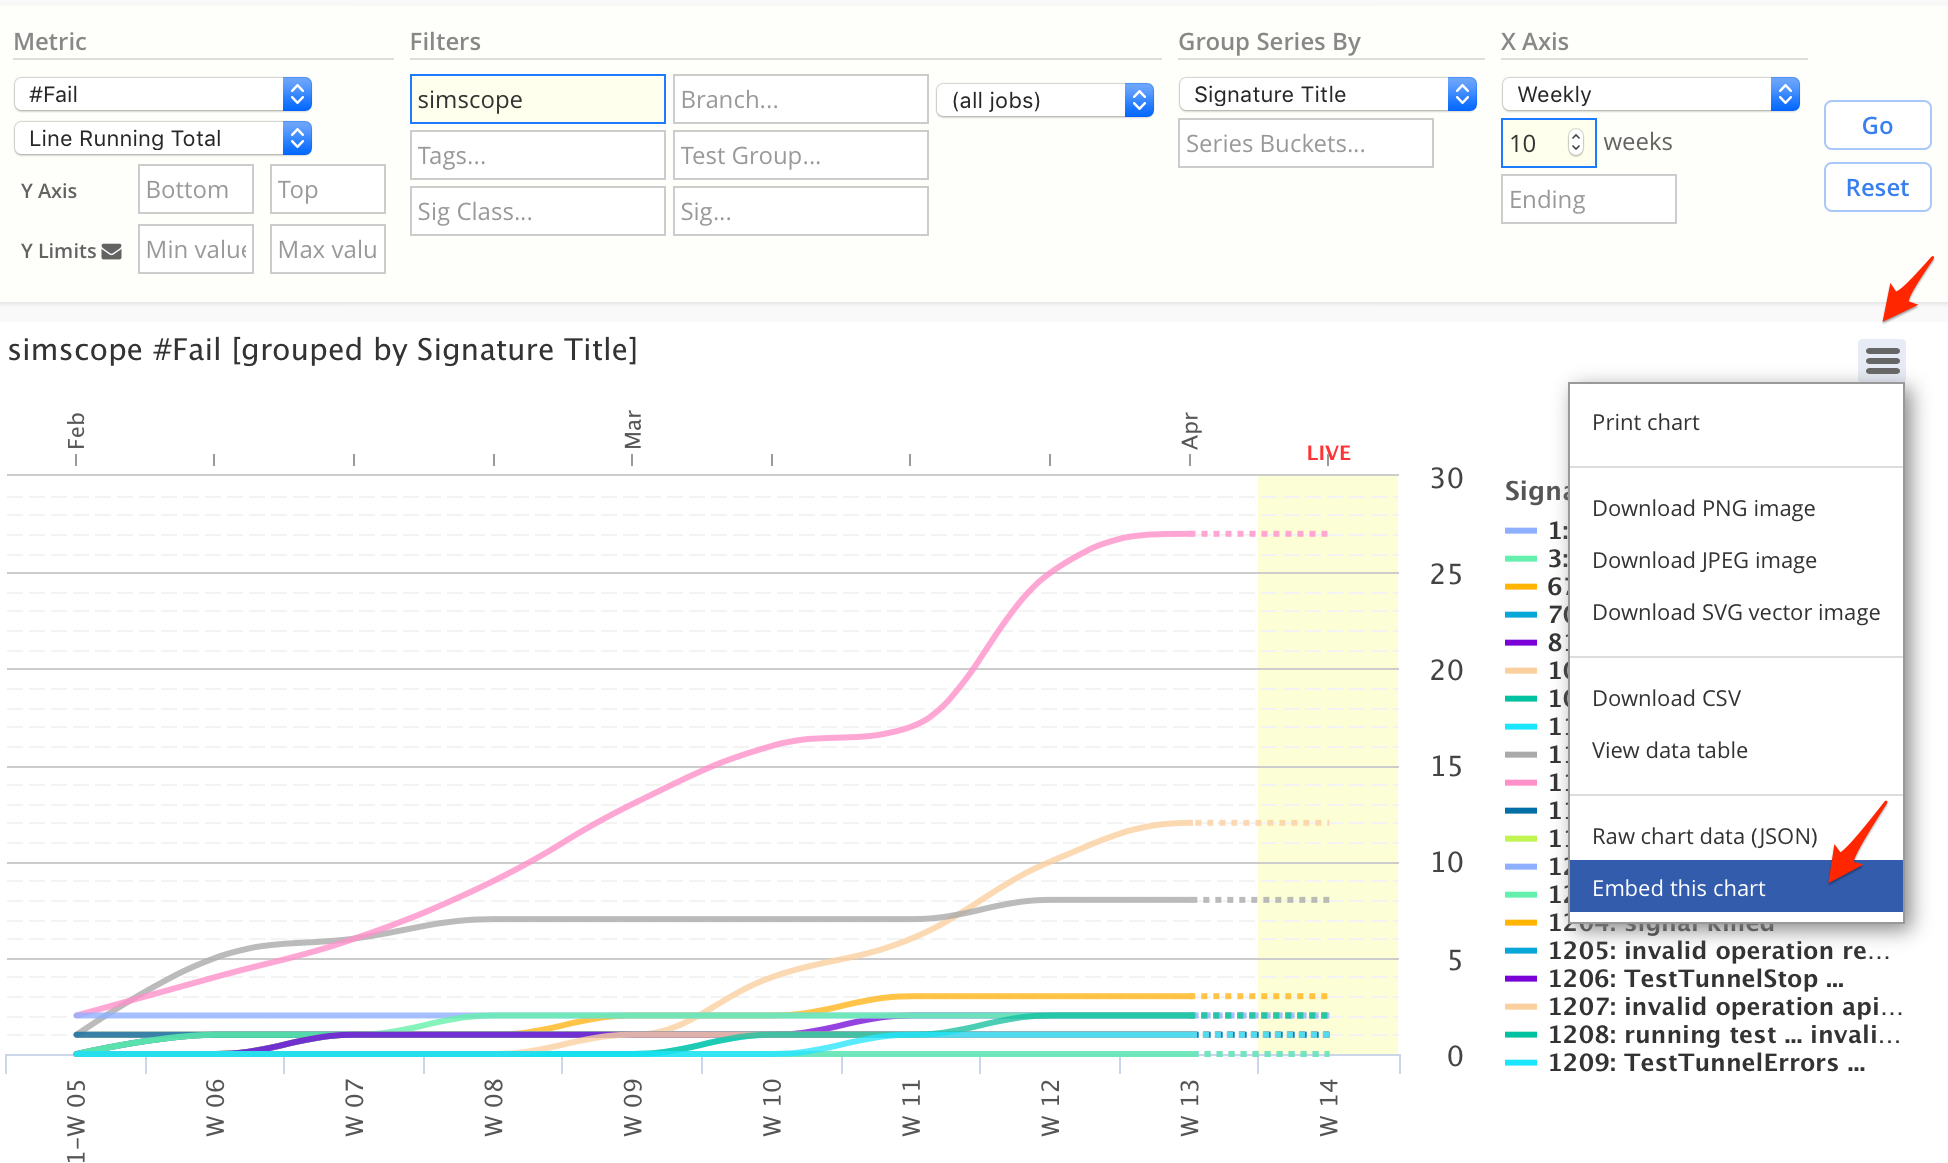
1. feature Share public charts
Charts can now be shared in Simscope, without needing a login to view.
- In the top-right corner of the Chart Editor, click the Trigram ☰
- Then click Embed this chart
→ This link contains a &share parameter, which can be viewed by anyone. For example,
you can use this to embed a public chart in a Confluence <iframe>.
Here is how to make a shared chart link:
2. bugfix Heatmap limits
Heatmap charts with limits now visually show out-of-limit values.
1.312
1. feature Statistics tables can be coped to clipboard
Click the + link in the upper-left corner of a statistics table to copy to your clipboard.
- Then hit
Ctrl-v(orCmd-v) to paste into an email, Excel, text file, etc.
For example, if you click the + in this table:
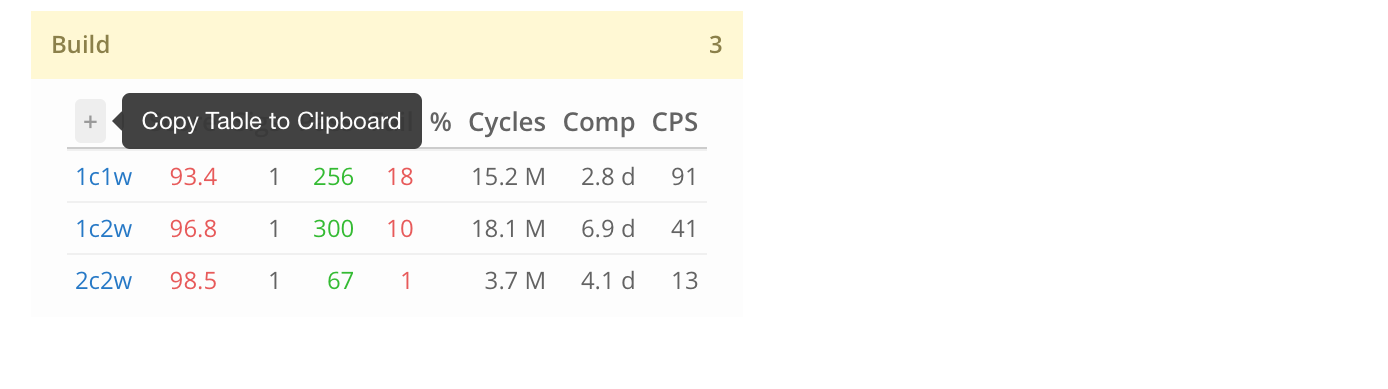
This would paste from your clipboard as:
+       Score   Sigs  Pass  Fail  Cycles   Comp     CPS
1c1w    93.4    1     256   18    15.2 M   2.8 d    91
1c2w    96.8    1     300   10    18.1 M   6.9 d    41
2c2w    98.5    1     67    1     3.7 M    4.1 d    13
2. feature Tagged-mode unique drilldown
When filtering by tag, Simscope has changed the default to a unique behavior, where only shows tags matching the filter, rather than related tags.
For example, if a job contains the tags 4core+vcs+random, and you filter by
core, only 4core (or 2core, etc) will show up in the filter table.
The previous behavior would let you search for jobs containing both 4core and vcs.
To enable the previous drilldown behavior, add this to your simscope.config file:
[tests]
tagdrilldown = true
3. bugfix Chart bugfixes
-
Administrators saving charts into another user's area now displays a warning dialog with confirmation.
-
Large legends now render properly in fullscreen mode
-
Long titles now get abbreviated
1.311
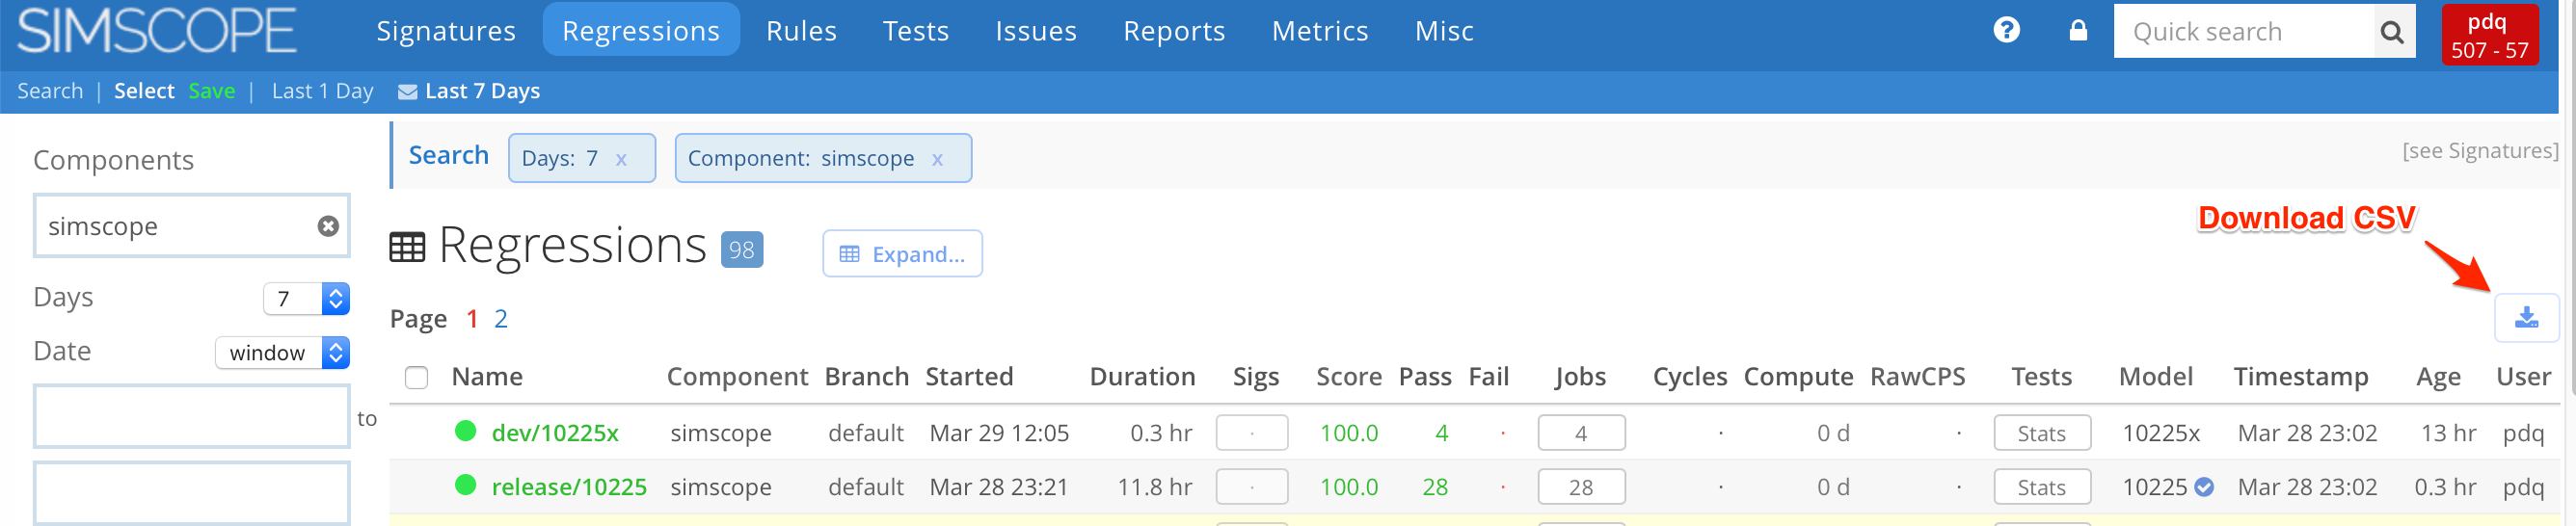
feature Download CSV for Users and Regressions
The Users and Regressions tables can now be downloaded in CSV format.
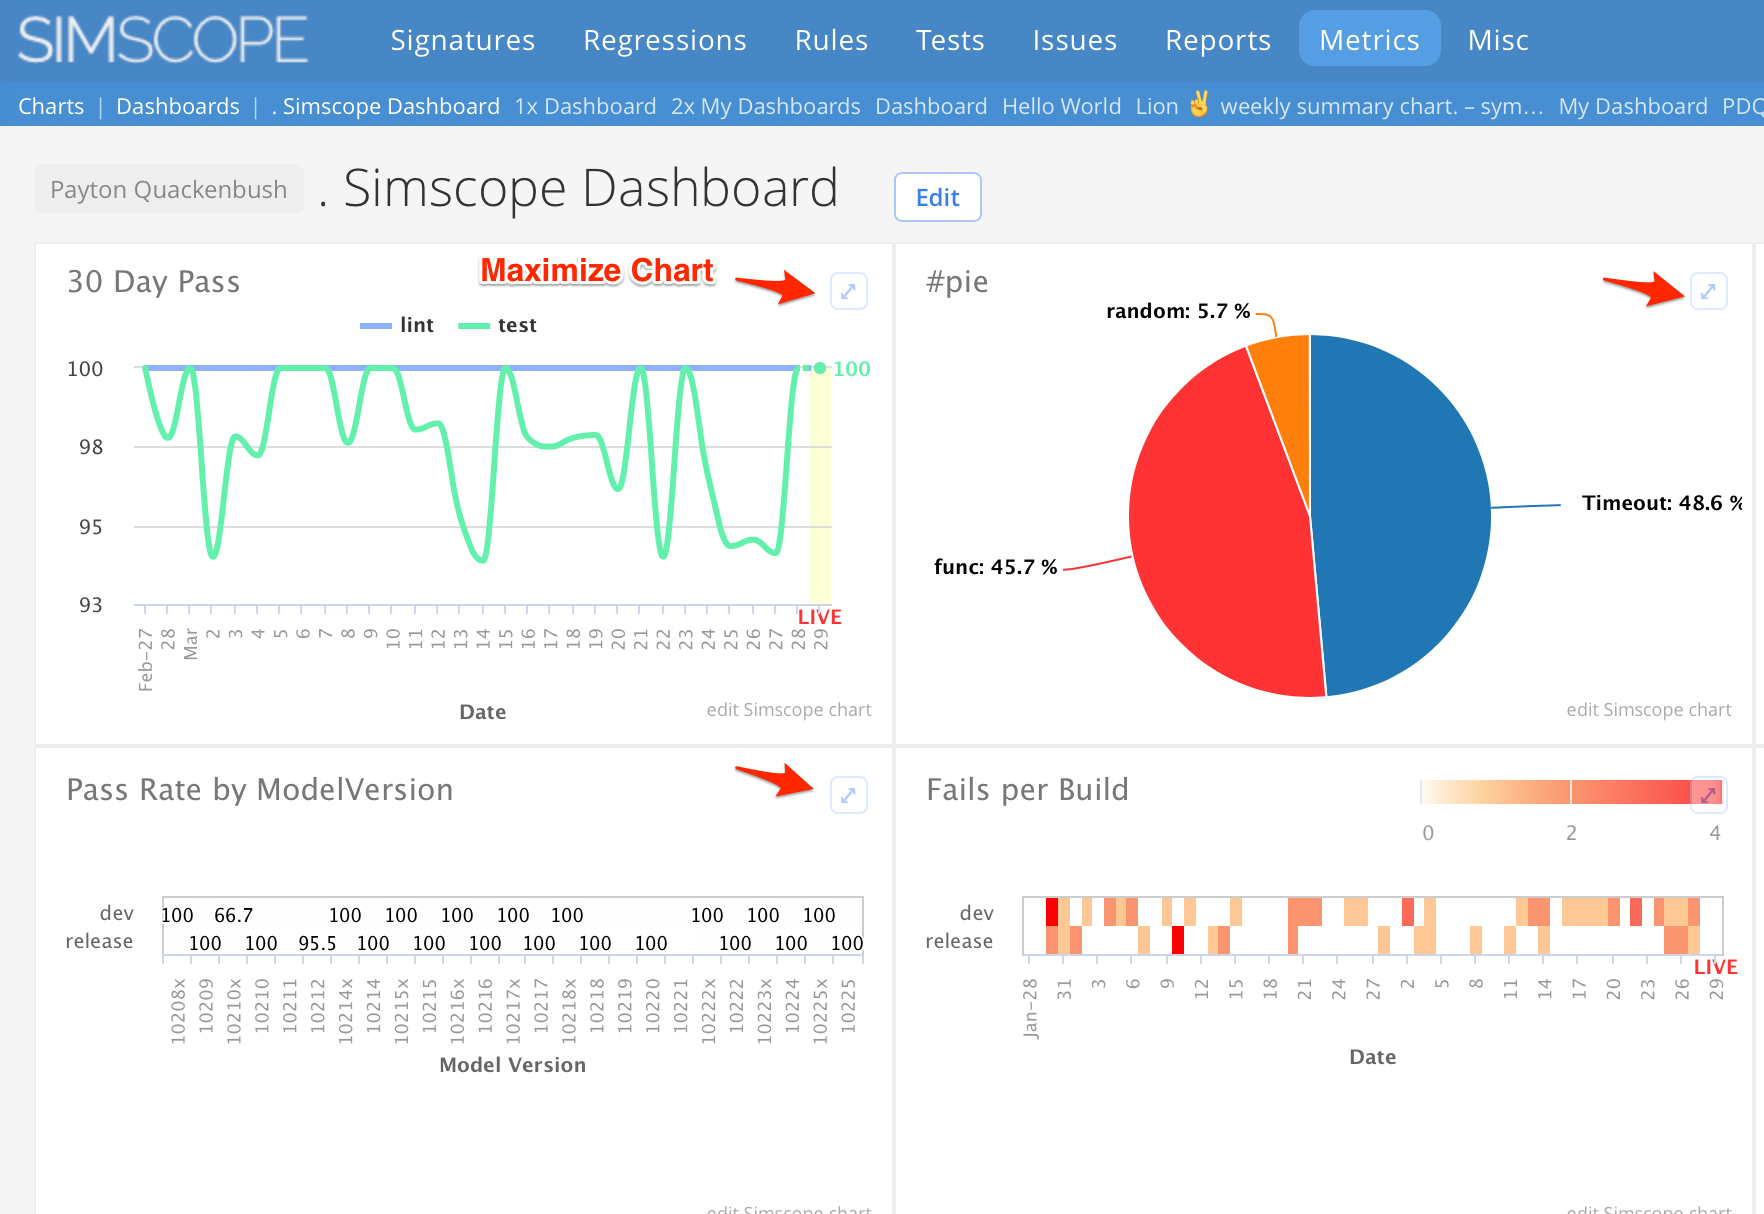
feature Dashboard: Maximize
Dashboard charts can now be maximized by clicking the button in the top-right corner.
bugfix Chart errors now show links
Charts with errors inside of dashboards now render a link to the chart details, so they can be investigated.
feature Components can now have multiple Dashboard templates
This example sets up two component dashboard templates:
[chart]
dashboardtemplate = "pdq/Unit Dashboard"
dashboardtemplate = "pdq/Integration Dashboard"
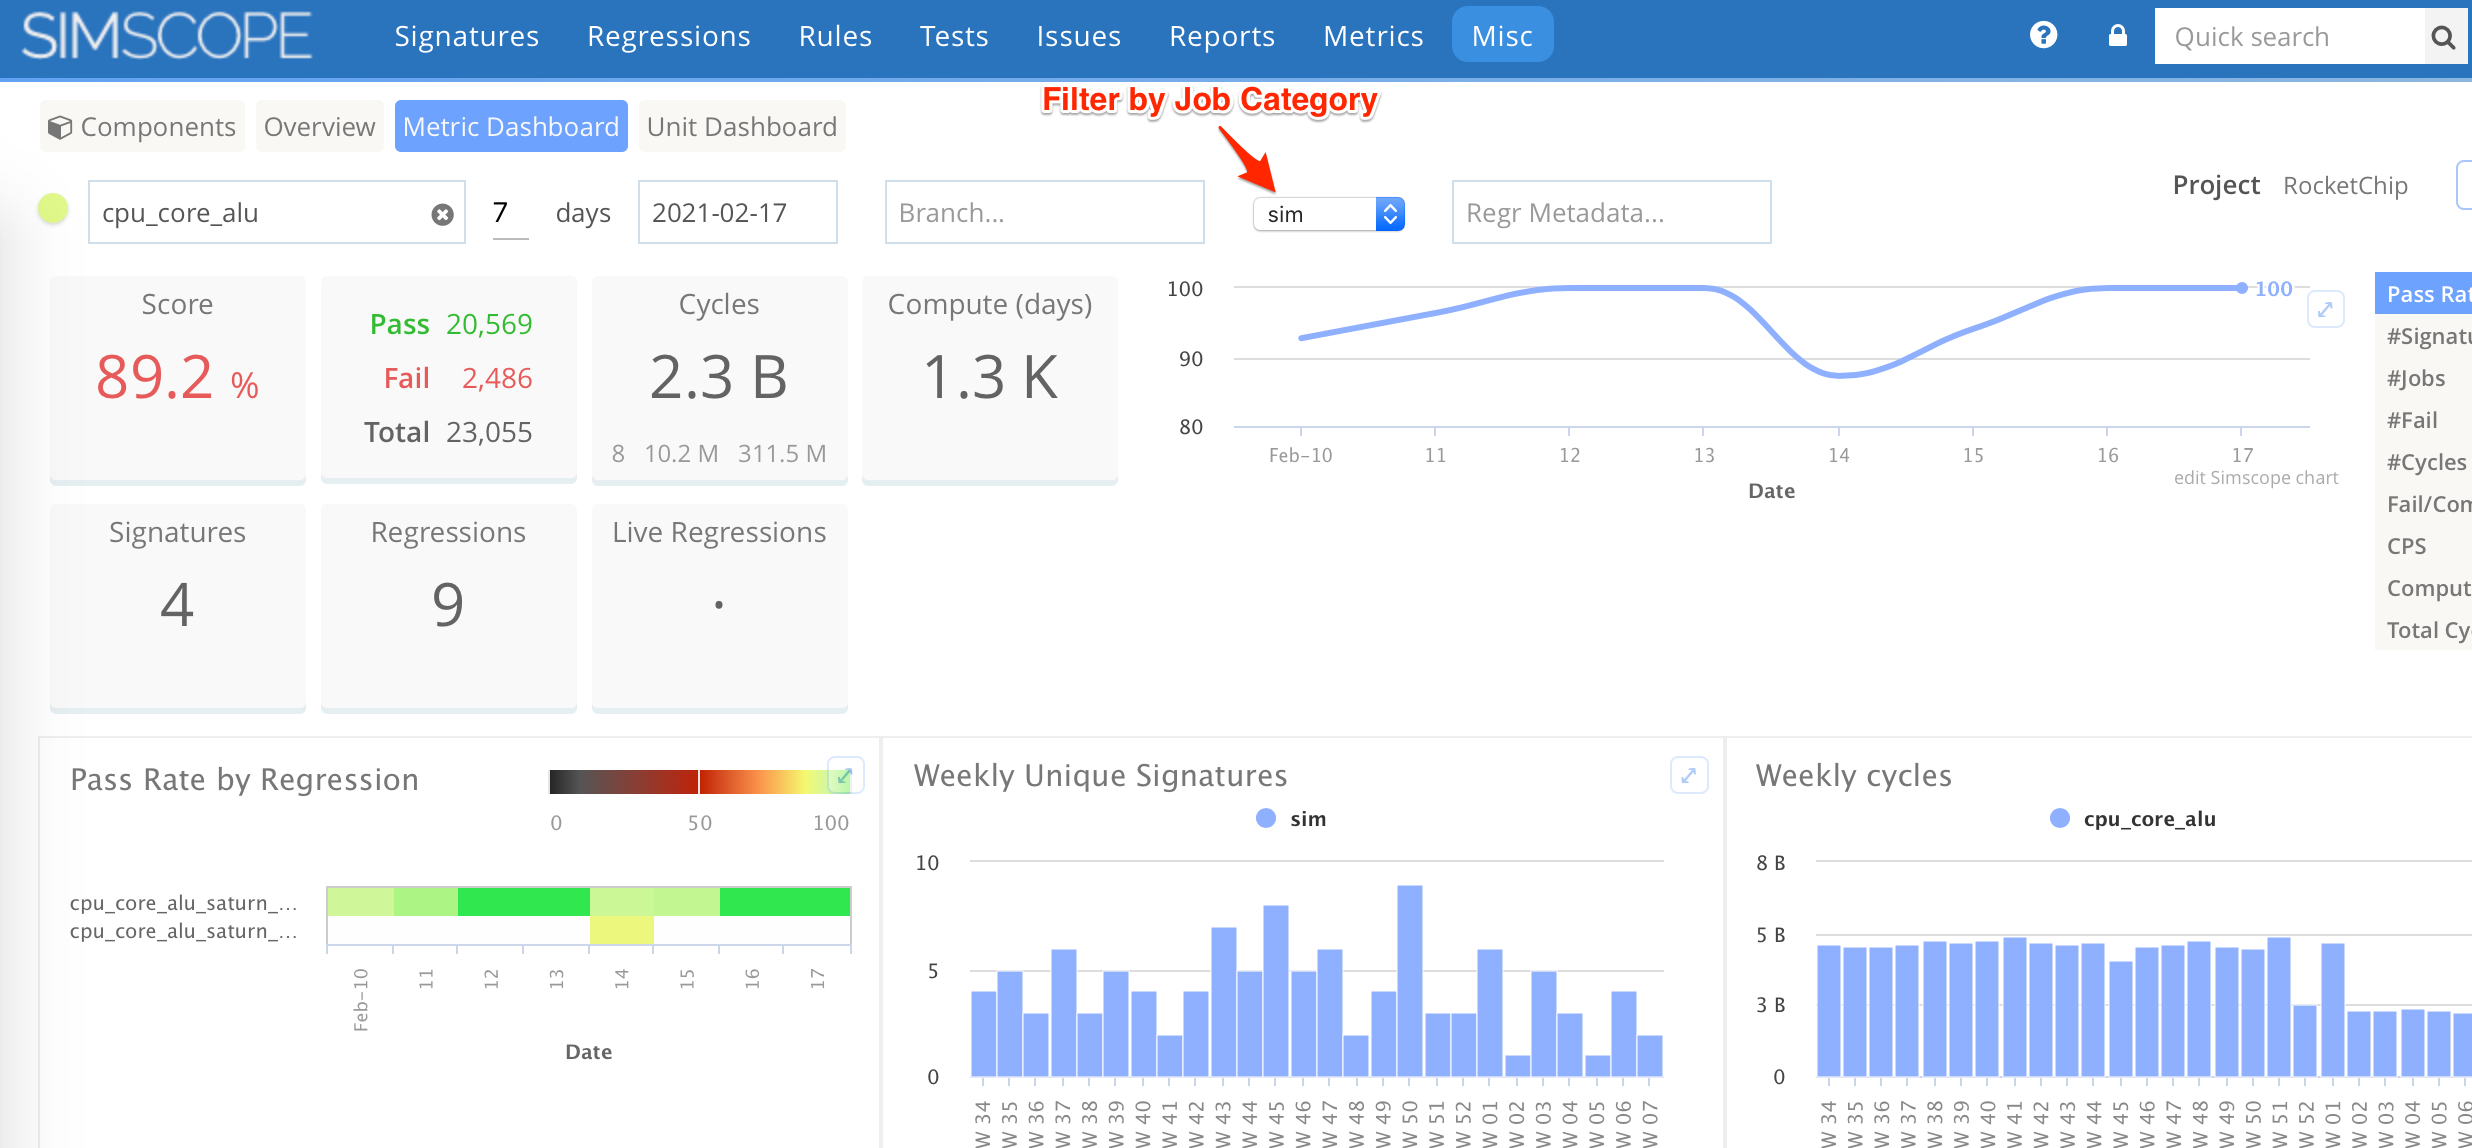
feature Filter component Dashboard by job category
For example, you can filter to just show simulations.
bugfix Projects without workspacepath
[project] sections in simscope.config no longer require a workspacepath field, for groups
not needing a workspace in their plugins.
1.310
1. feature Tanking LIVE regressions
LIVE regressions can now be tanked.
- If future jobs are imported into tanked regressions, they will be dropped automatically.
2. feature Administrators can edit any chart
Administrators can now save over any user's chart, and can also rename or delete them.
- Note: to save into a user's area prefix the chart name with
USERID/Chart Name
3. feature Administrators can edit any dashboard
Administrators can now save over any user's dashboard, and can also delete them.
4. bugfix Test sort by date now shows a red up/down arrow
This now shows a red arrow when sorting.
5. bugfix Components with disabled projects
An extraneous warning during Simscope startup for components with disabled projects is now removed.
6. bugfix Regression metadata URL-links
Regression metadata URL-links now show up in the left-hand column, instead of the right-hand column.
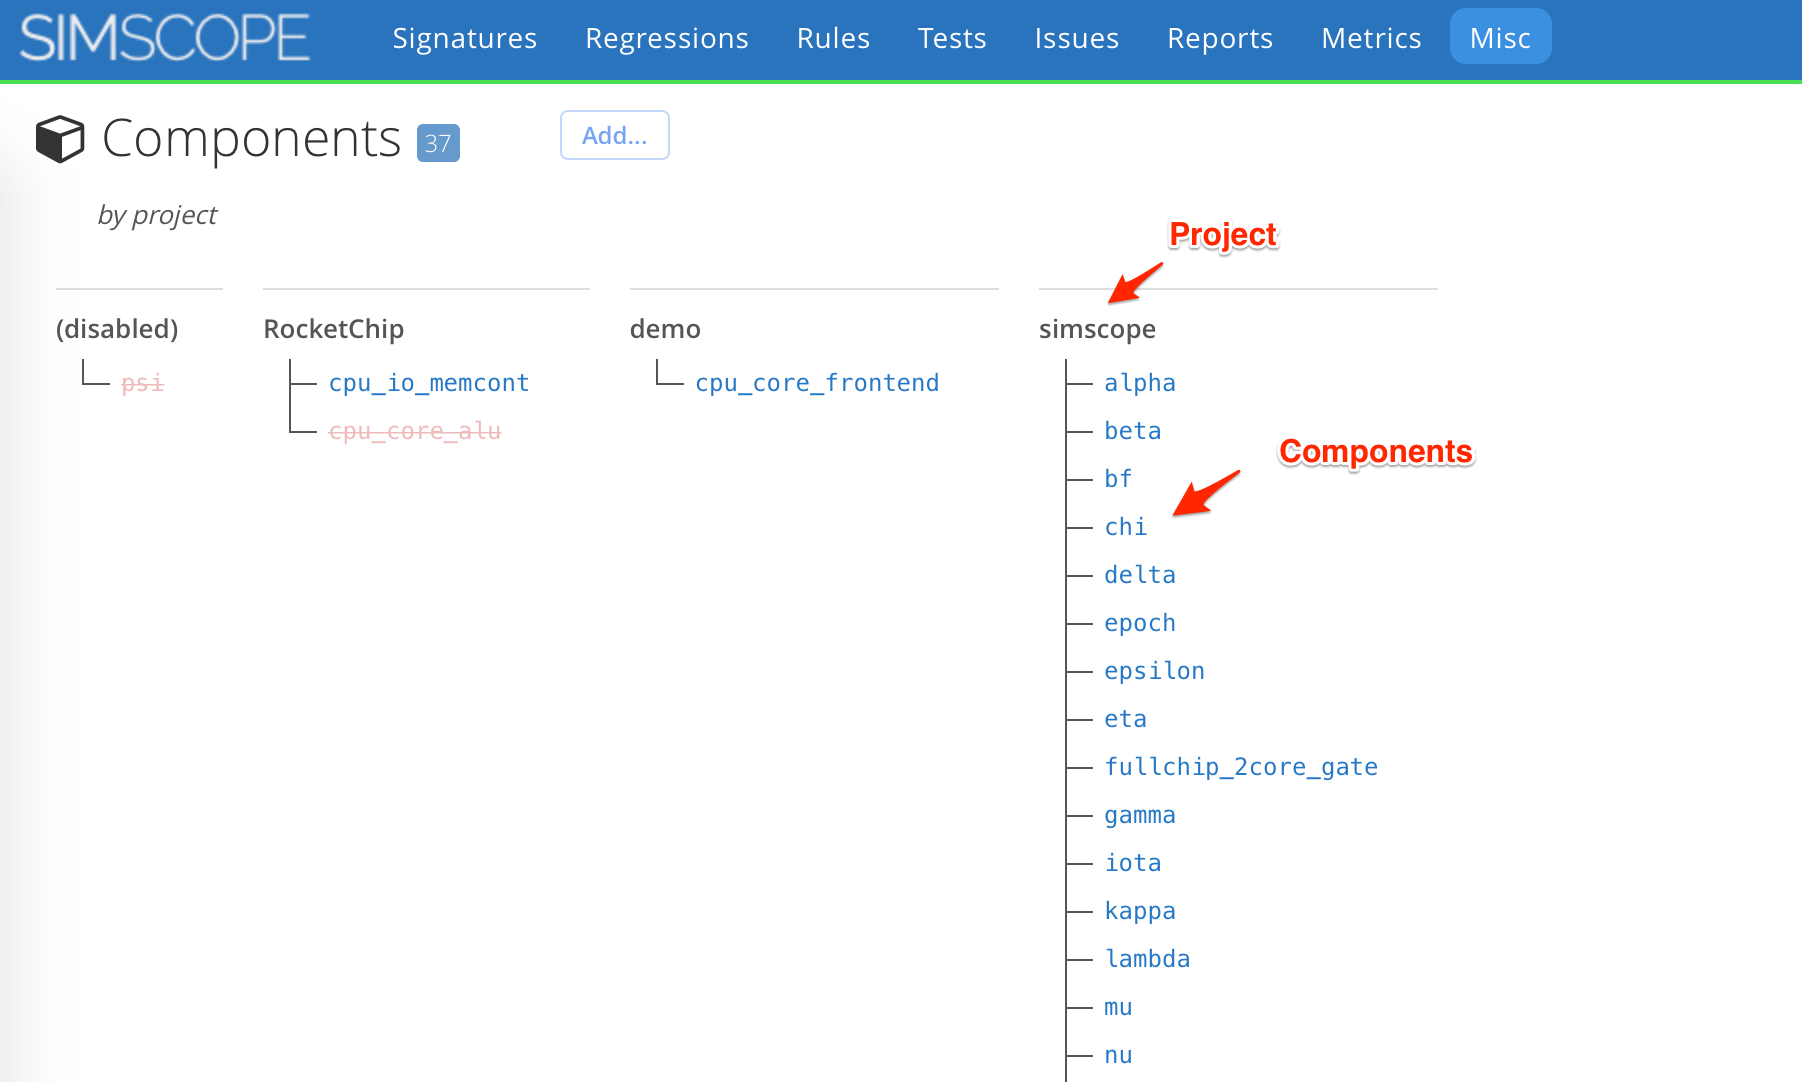
7. feature Component Tree
The Component page now lists components hierarchically (tree format) under their parent Project.