Regression Metadata (custom_metadata)
The Regression field custom_metadata array is an optional array of
Key/Value pairs, so you can post any regression-specific metadata into Simscope.
Note: Regression
custom_metadatais different from Job Metadata.
Example Uses of Regression Metadata
This can be used to store Regression-based:
- Coverage statistics
- Build/configuration info
- License seat usage tracking
- External URL links (e.g. Jenkins URL)
- Performance Data (e.g. Disk usage, Load, Transactions)
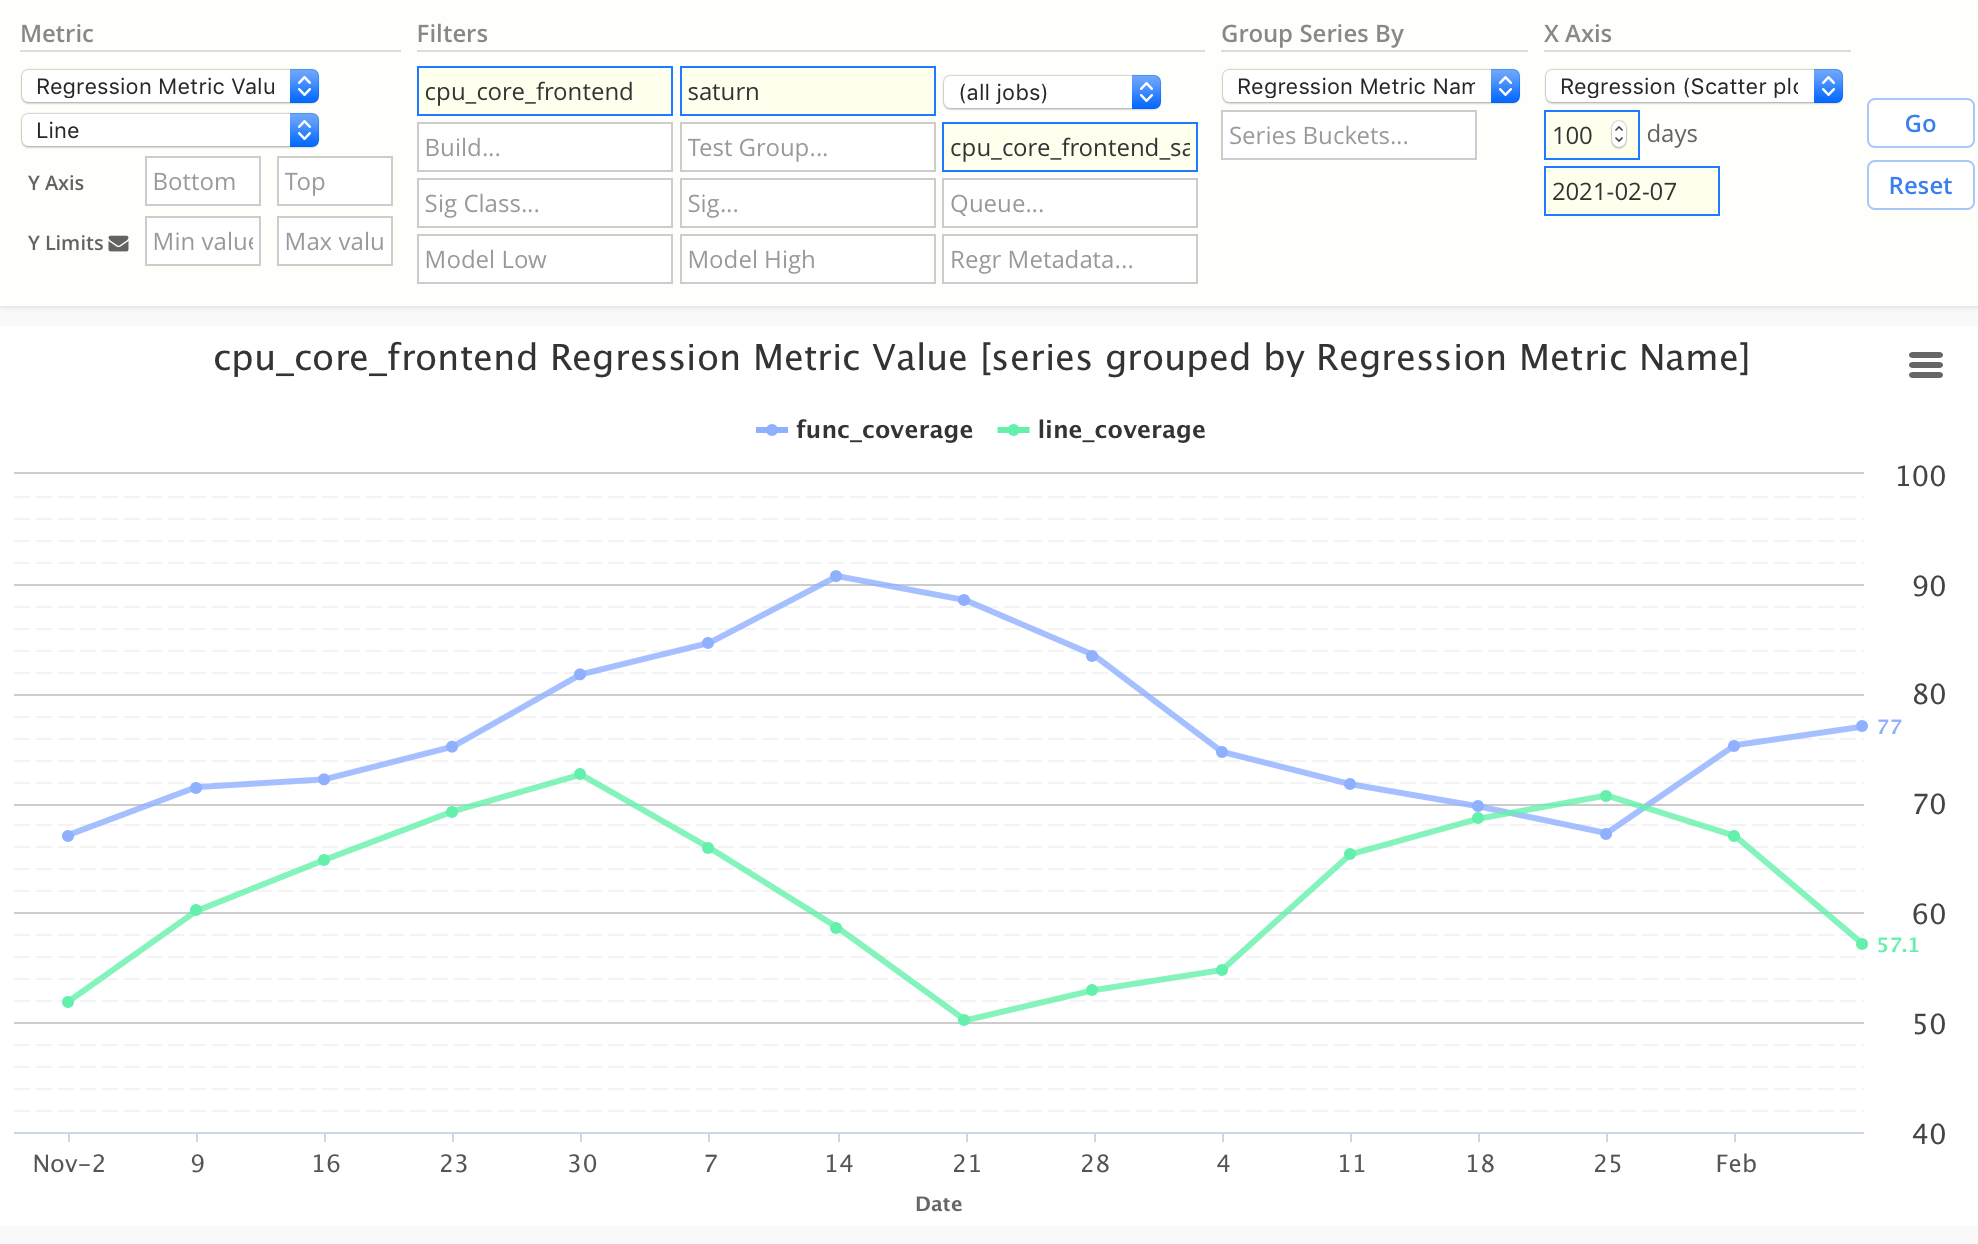
If the metadata is numeric (e.g. Coverage Percentage), Simscope can also automatically plot charts of them.
Example Chart using custom metadata
This chart is plotting func_coverage and line_coverage:
custom_metadata Format
The format to encode regression metadata in JSON is an array of [KEY,VALUE] pairs:
- Both
KEYandVALUEare encoded as string values. - You can post any data for the value, but it must be quoted as a string.
The key can be any string (including spaces):
"Functional Coverage""config""cpu core"
Example metadata values:
"1234567"(ie integer value)"97.2"(ie floating point value)"true""0x123""+foo +bar"(string)"http://example.com/foo/bar"(ie a URL hyperlink)
Note: all numeric values must be quoted as strings (ie
"97.2"instead of97.2)
Basic JSON Example
Example JSON with a single metadata value:
"custom_metadata": [
    ["Functional Coverage", "97.2"]
]
Multiple metadata
You can have multiple metadata in a regression by separating each [KEY,VALUE] pair by commas.
Here is an example:
"custom_metadata": [
    ["Functional Coverage", "97.2"],
    ["line_cov", "94.6"],
    ["vcs_license_seats", "18"],
    ["Core configuration", "2/1/4/8"],
    ["Coverage URL", "http://myserver/cov/123.html"]
]
Charting Regression Metadata
If you post regressions with numeric (floating point) custom_metadata values (e.g. "97.2"),
these can be charted in Simscope.
- You can also create email notifications on these metadata.
→ See Create Coverage charts in Simscope for chart examples.
Optional: Regression Metadata units and scales
If you would like to chart regression metadata with scales, you can add these to
your simscope.config file under the [regr] section.
Here is an example with 2 metadata units (the first example is a megabyte unit):
[regr]
# Custom regression metadata units
metaunit = "disk_usage_mb:MB"
metaunit = "total_transactions:k transactions"
Adding Regressions metadata into the Regression search table
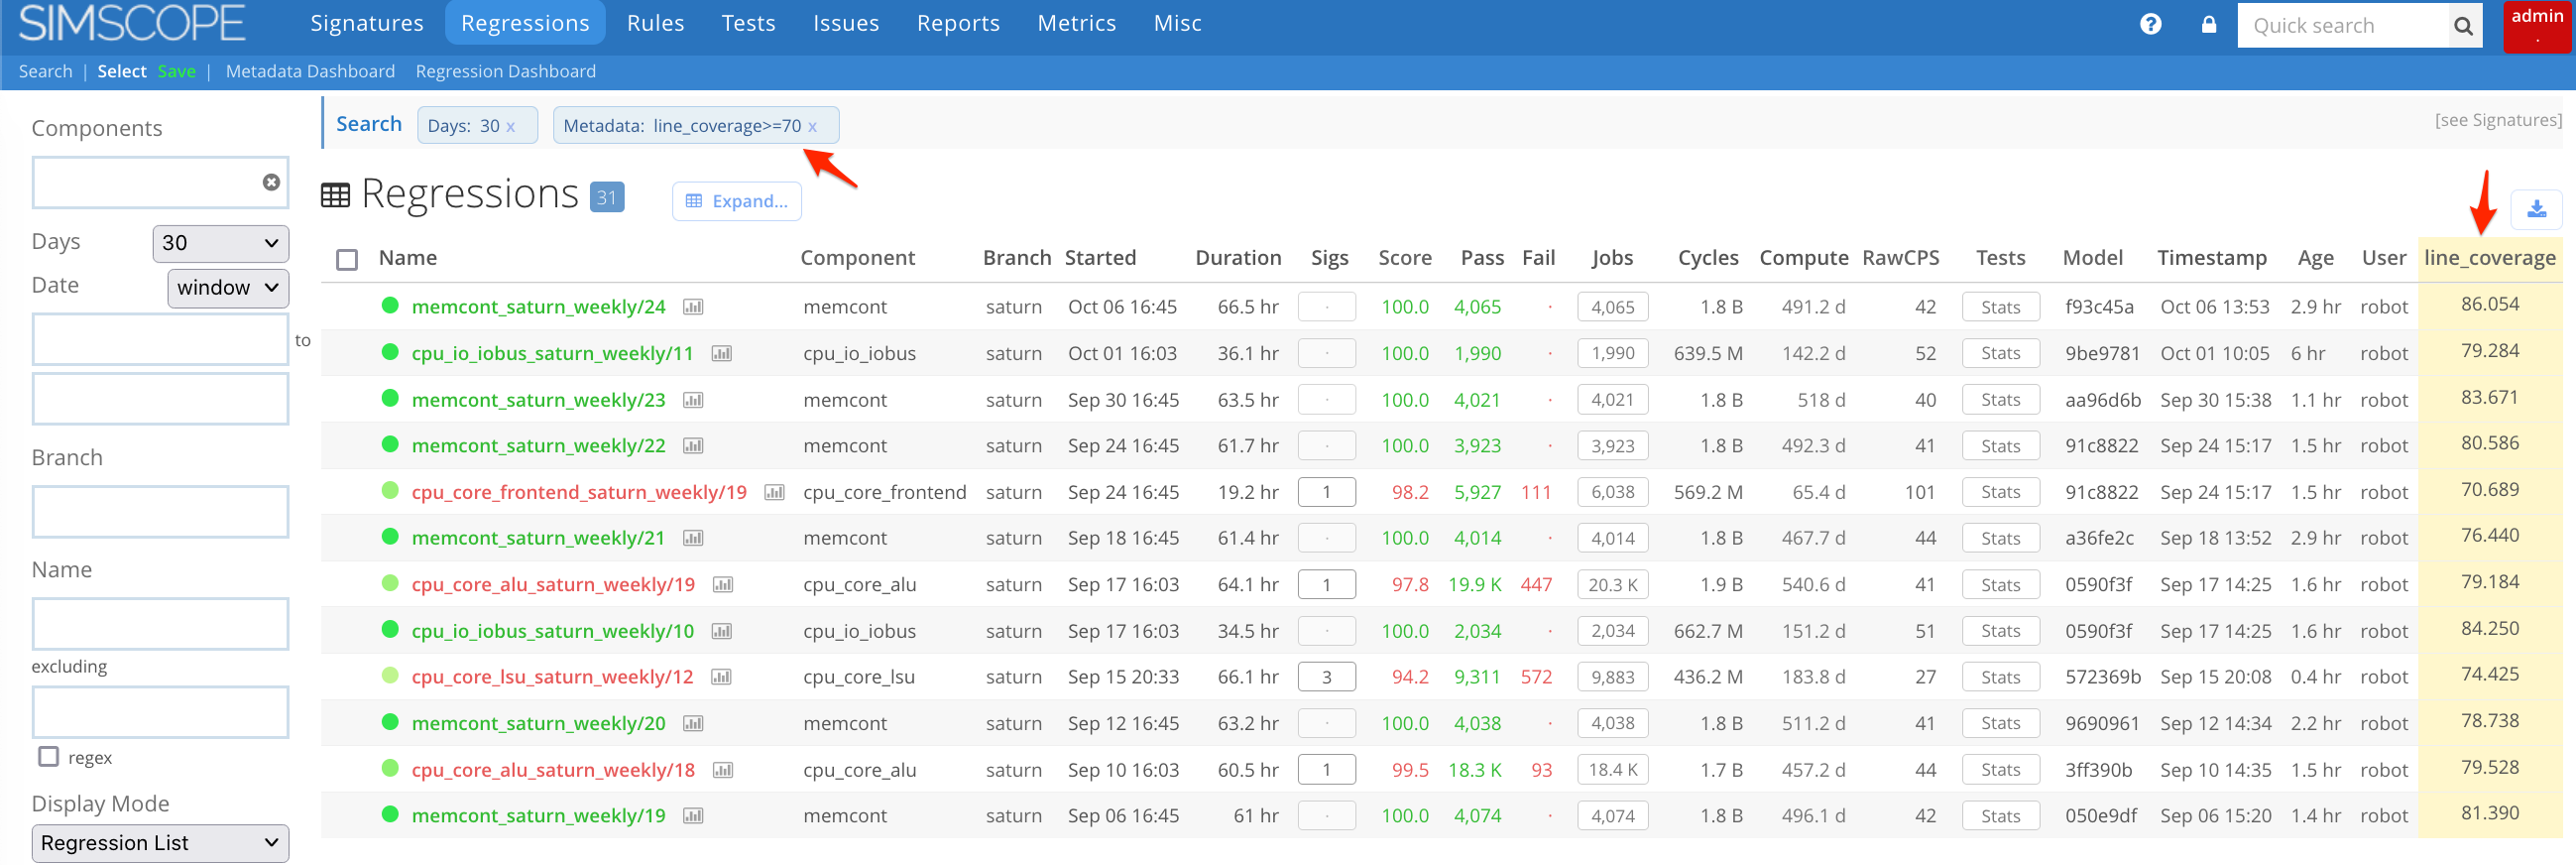
You can customize the Simscope view of Regression table to add metadata columns to the right side.
To enable, add one or more tablemeta values to your simscope.config file.
- Note: metadata columns are currently globally displayed across all regression tables, even if the regressions have blank metadata values.
Example
Here is an example adding 2 metadata columns to the Regression table:
[regr]
# Show additional regression metadata columns
tablemeta = "P4 Changelist"
tablemeta = ".Coverage %"
Boolean comparison operators
Regression metadata can be filtered based on their numeric value, any of the following boolean comparison operators:
=>>=<<=
For example, to filter regressions containing line_coverage with a value at least 70%:
line_coverage>=70
Multiple metadata field matching
Simscope can both search and display multiple regression metadata columns by separating columns with commas:
- To show regressions containing
line_coverage, use:line_coverage
- To show regressions containing
line_coverageandfunc_coverage, use:line_coverage,func_coverage
- To show all metadata columns, use:
.(regexdotindicates match anything)
- To filter regressions containing
line_coverageand then show all metadata, use:line_coverage,.


