Regression Metadata Dashboard (Grouped Regressions)
Simscope can show regressions grouped in a Metadata Dashboard view.
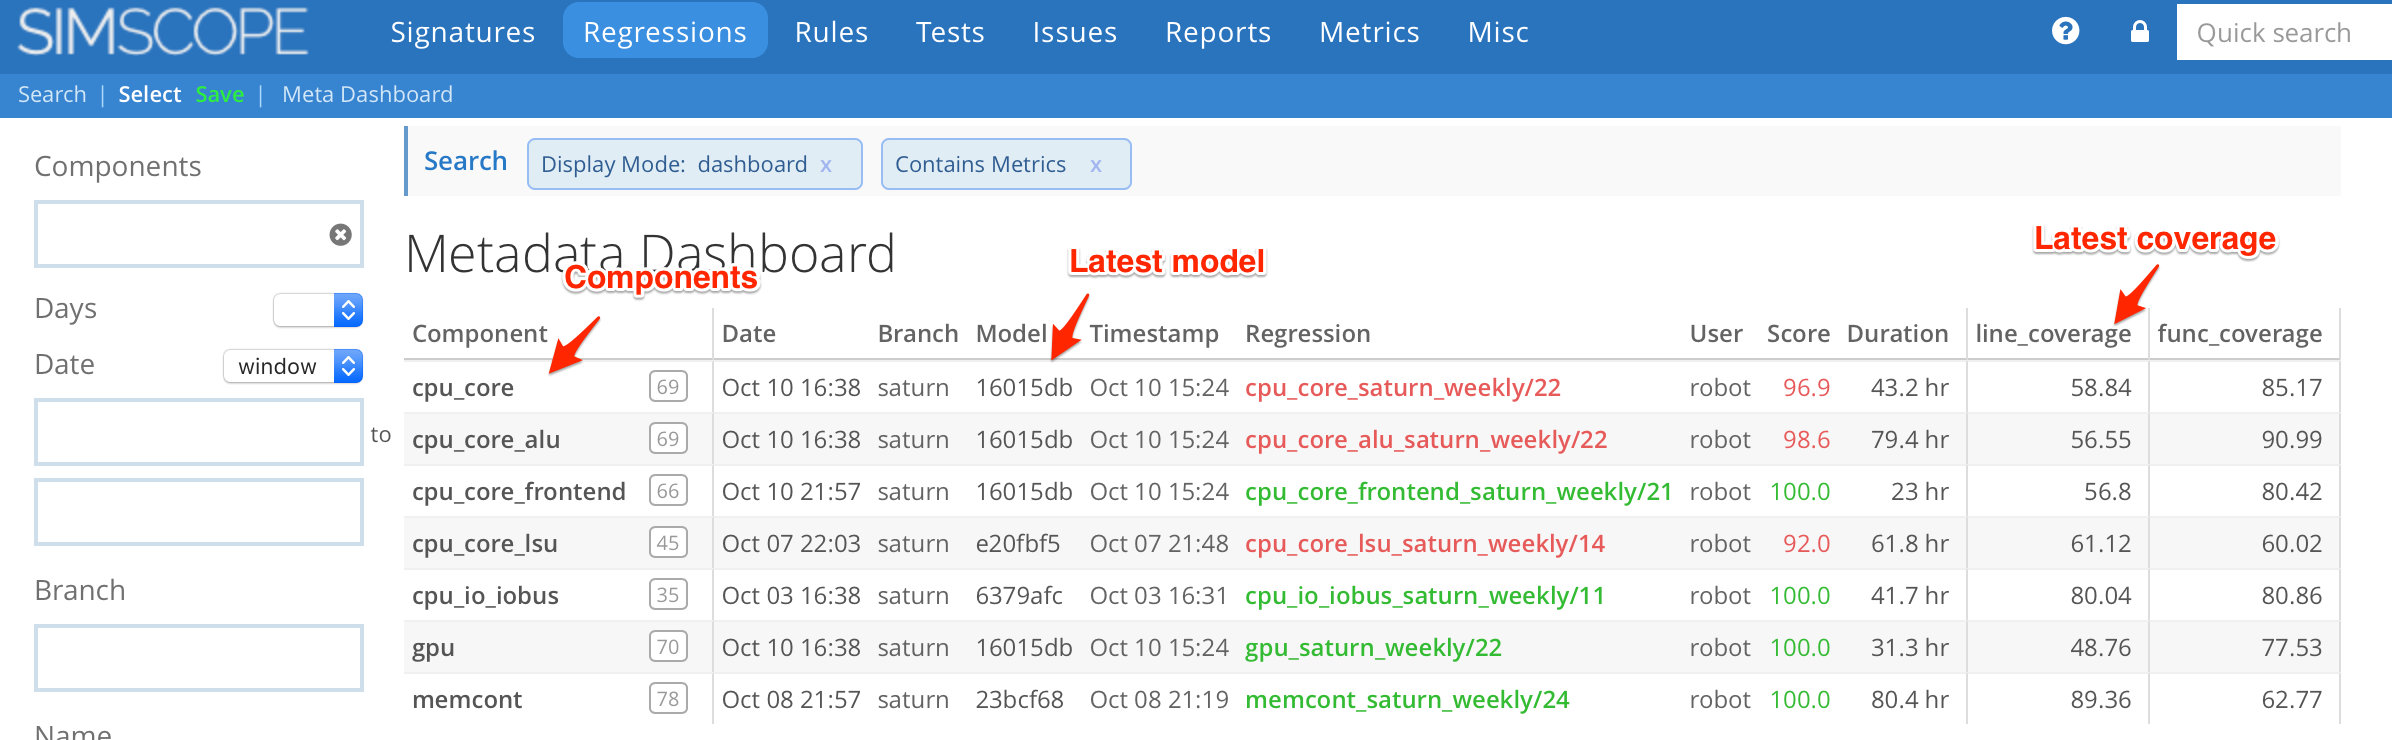
Here is an example, showing 7 components and their latest coverage.
Accessing the Dashboard
Regressions can now be grouped by Component, so you can view a high level of:
- Each component
- Latest model (ie SHA/changelist)
- Latest regression
- Latest metadata results
To view the Metadata Dashboard:
- Click Regressions at the top of any page.
- On the left side, under Display Mode click Metadata Dashboard.
Storing Regression Metadata
Any metadata in Regressions which are numeric (ie integer or float values) will display in the dashboard.
- String values will be omitted.
JSON data format
→ See the custom_metadata section for storing regression-level
metadata values via JSON.
Hierarchical Metadata
You can optionally store hierarchical metadata using the format PARENT.CHILD
For example, you can store Area.combo and Area.noncombo, and Simscope will
group these into:
- A parent group called
Area - Two child metadata points (
comboandnoncombo)
Hierarchical Example
Here is an example with 7 hierarchical metadata values:
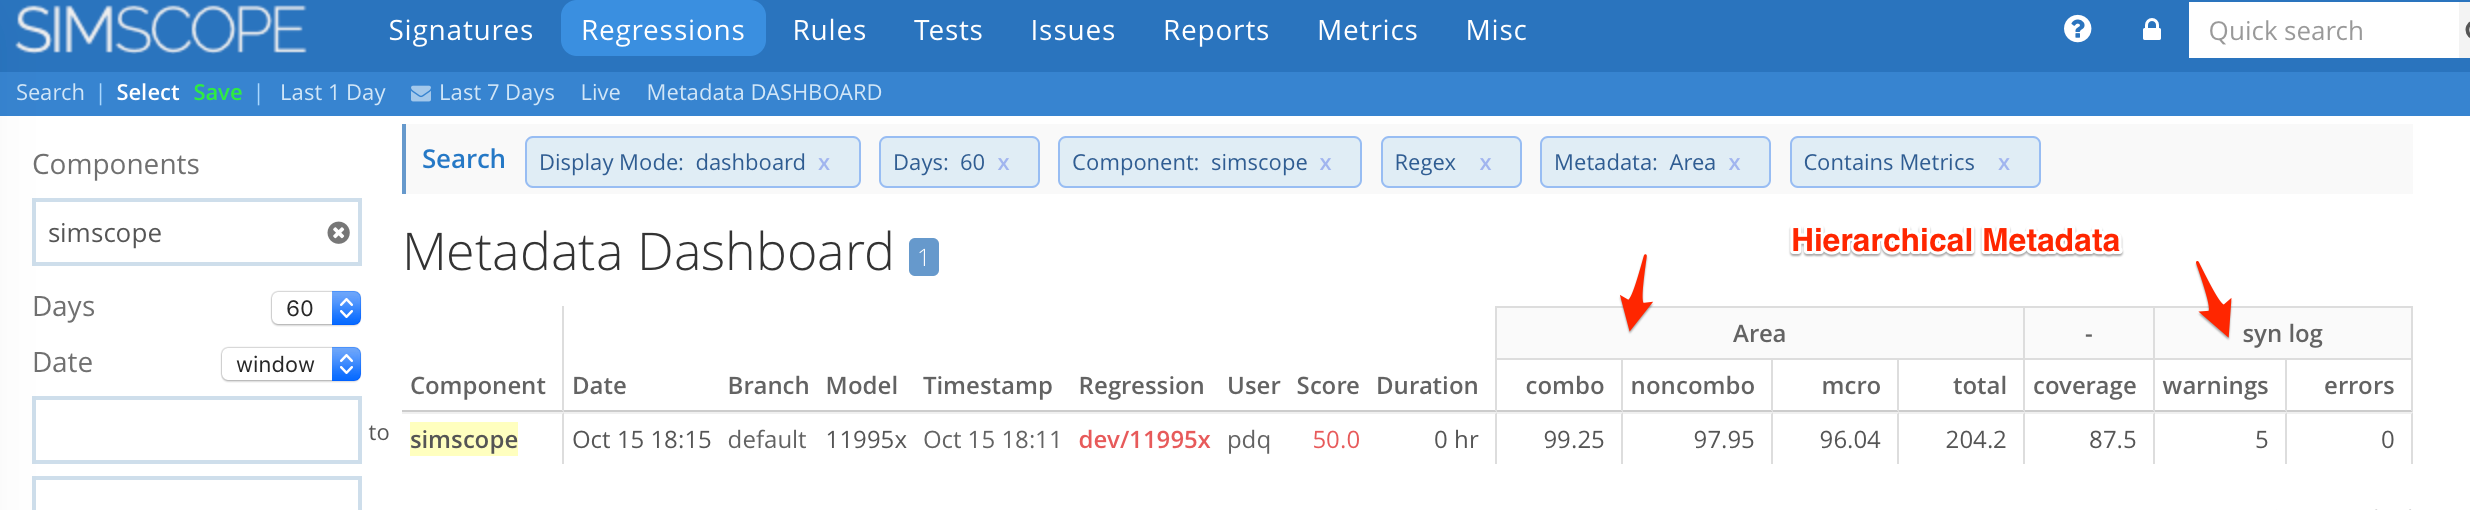
The Regression JSON metadata for this example is:
{
    "custom_metadata": [
        [
            "Area.combo",
            "99.25"
        ],
        [
            "Area.noncombo",
            "97.95"
        ],
        [
            "Area.mcro",
            "96.04"
        ],
        [
            "Area.total",
            "204.2"
        ],
        [
            "Configuration",
            "+foo +bar +daily-random"
        ],
        [
            "coverage",
            "87.5"
        ],
        [
            "syn log.warnings",
            "5"
        ],
        [
            "syn log.errors",
            "0"
        ]
    ]
}
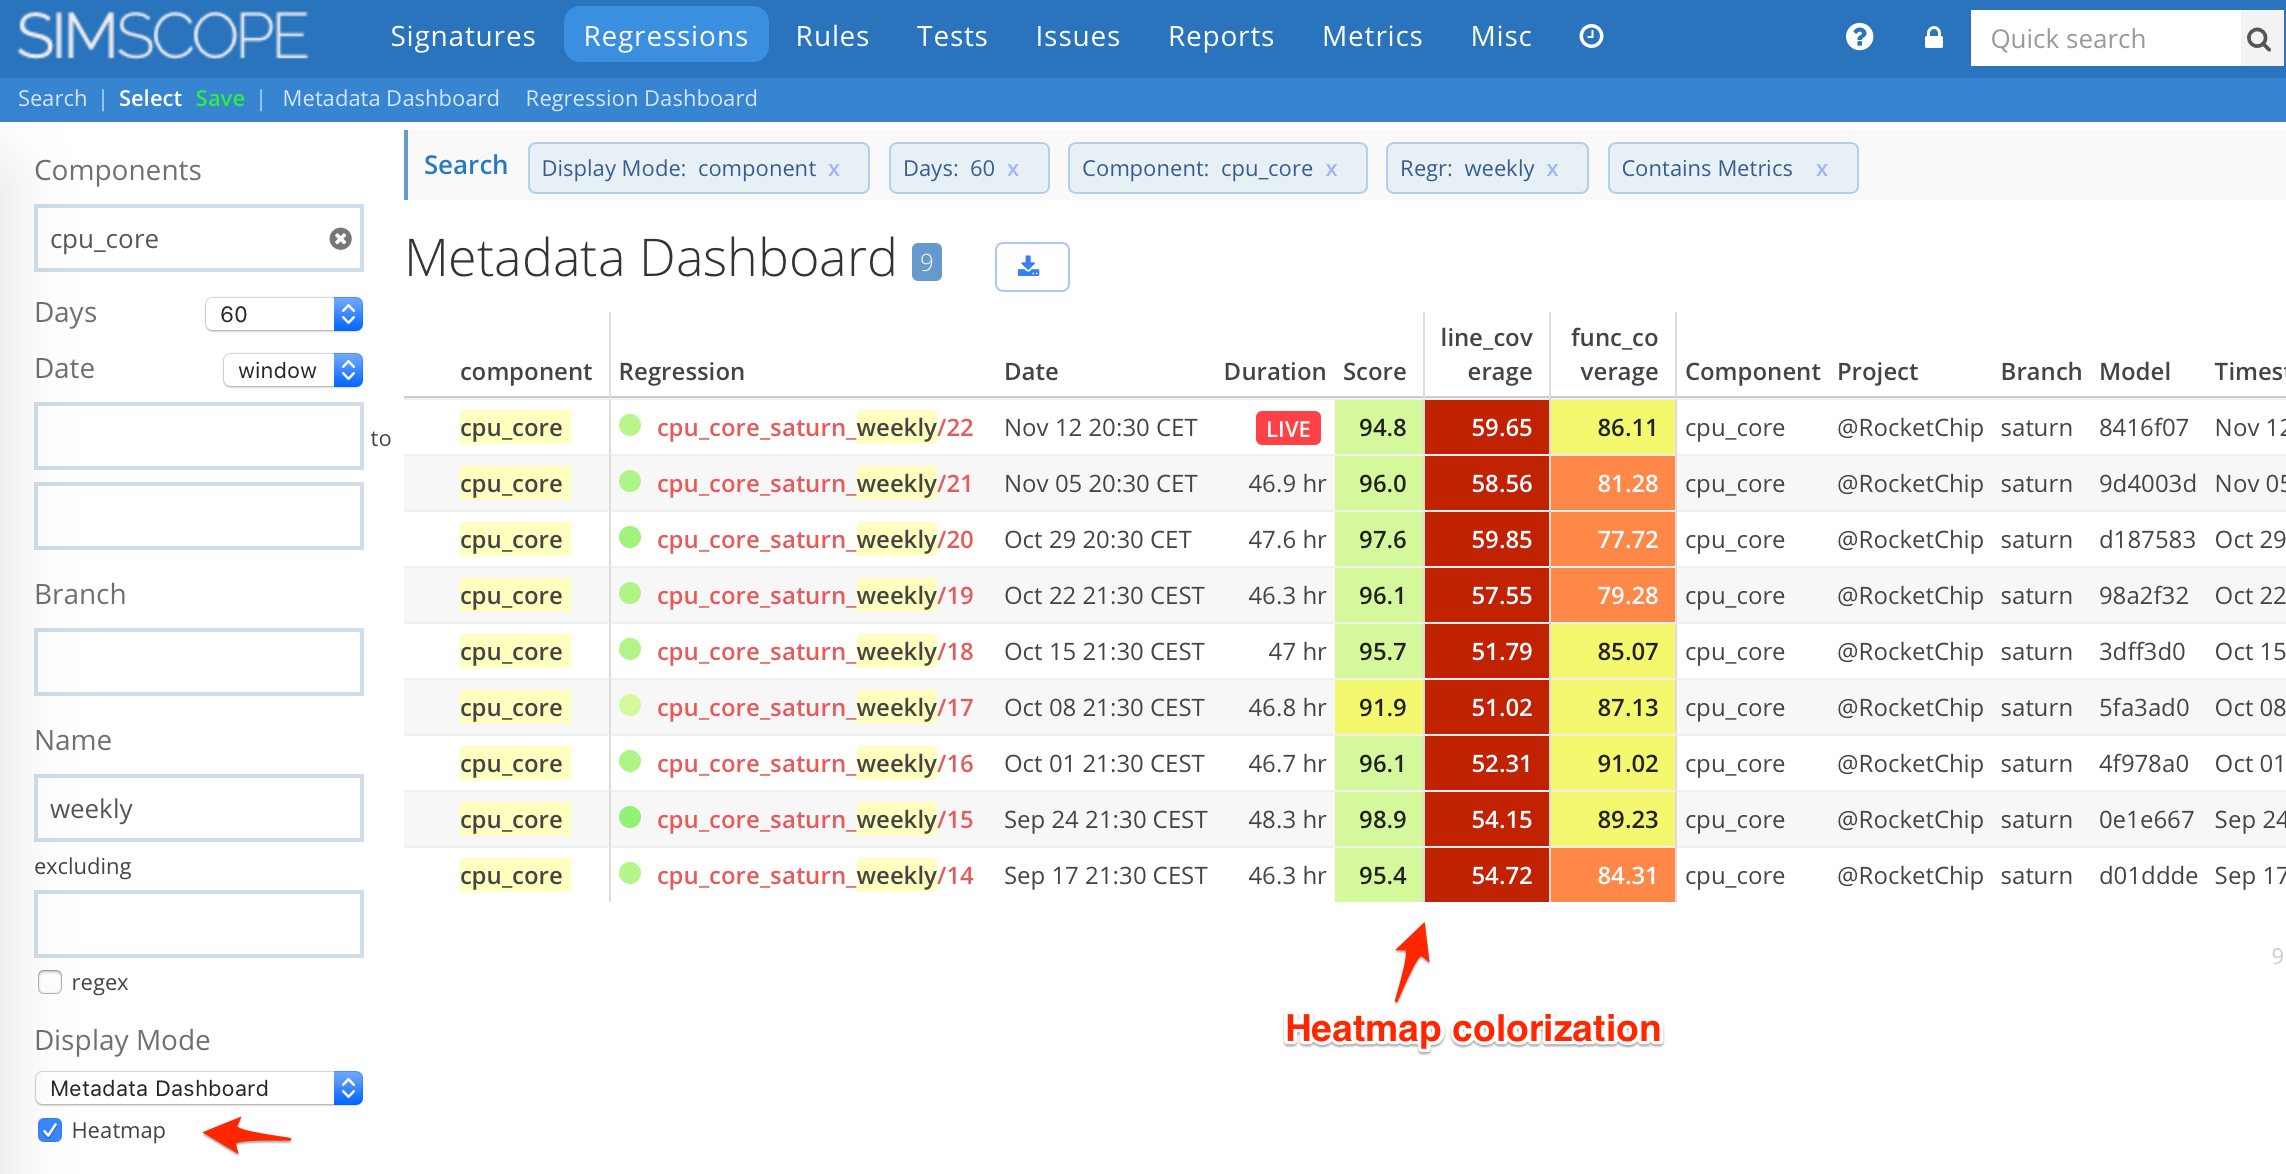
Heatmap Colorization
If you check the Heatmap checkbox, metadata fields will be rendered using the bulitin Heatmap color scheme, based on their values.
This makes it easier to spot metadata changes visually.
Colorize fields in the Regression Metric Dashboard
Metadata fields can be optionally colorized, similar to Heatmap Charts.
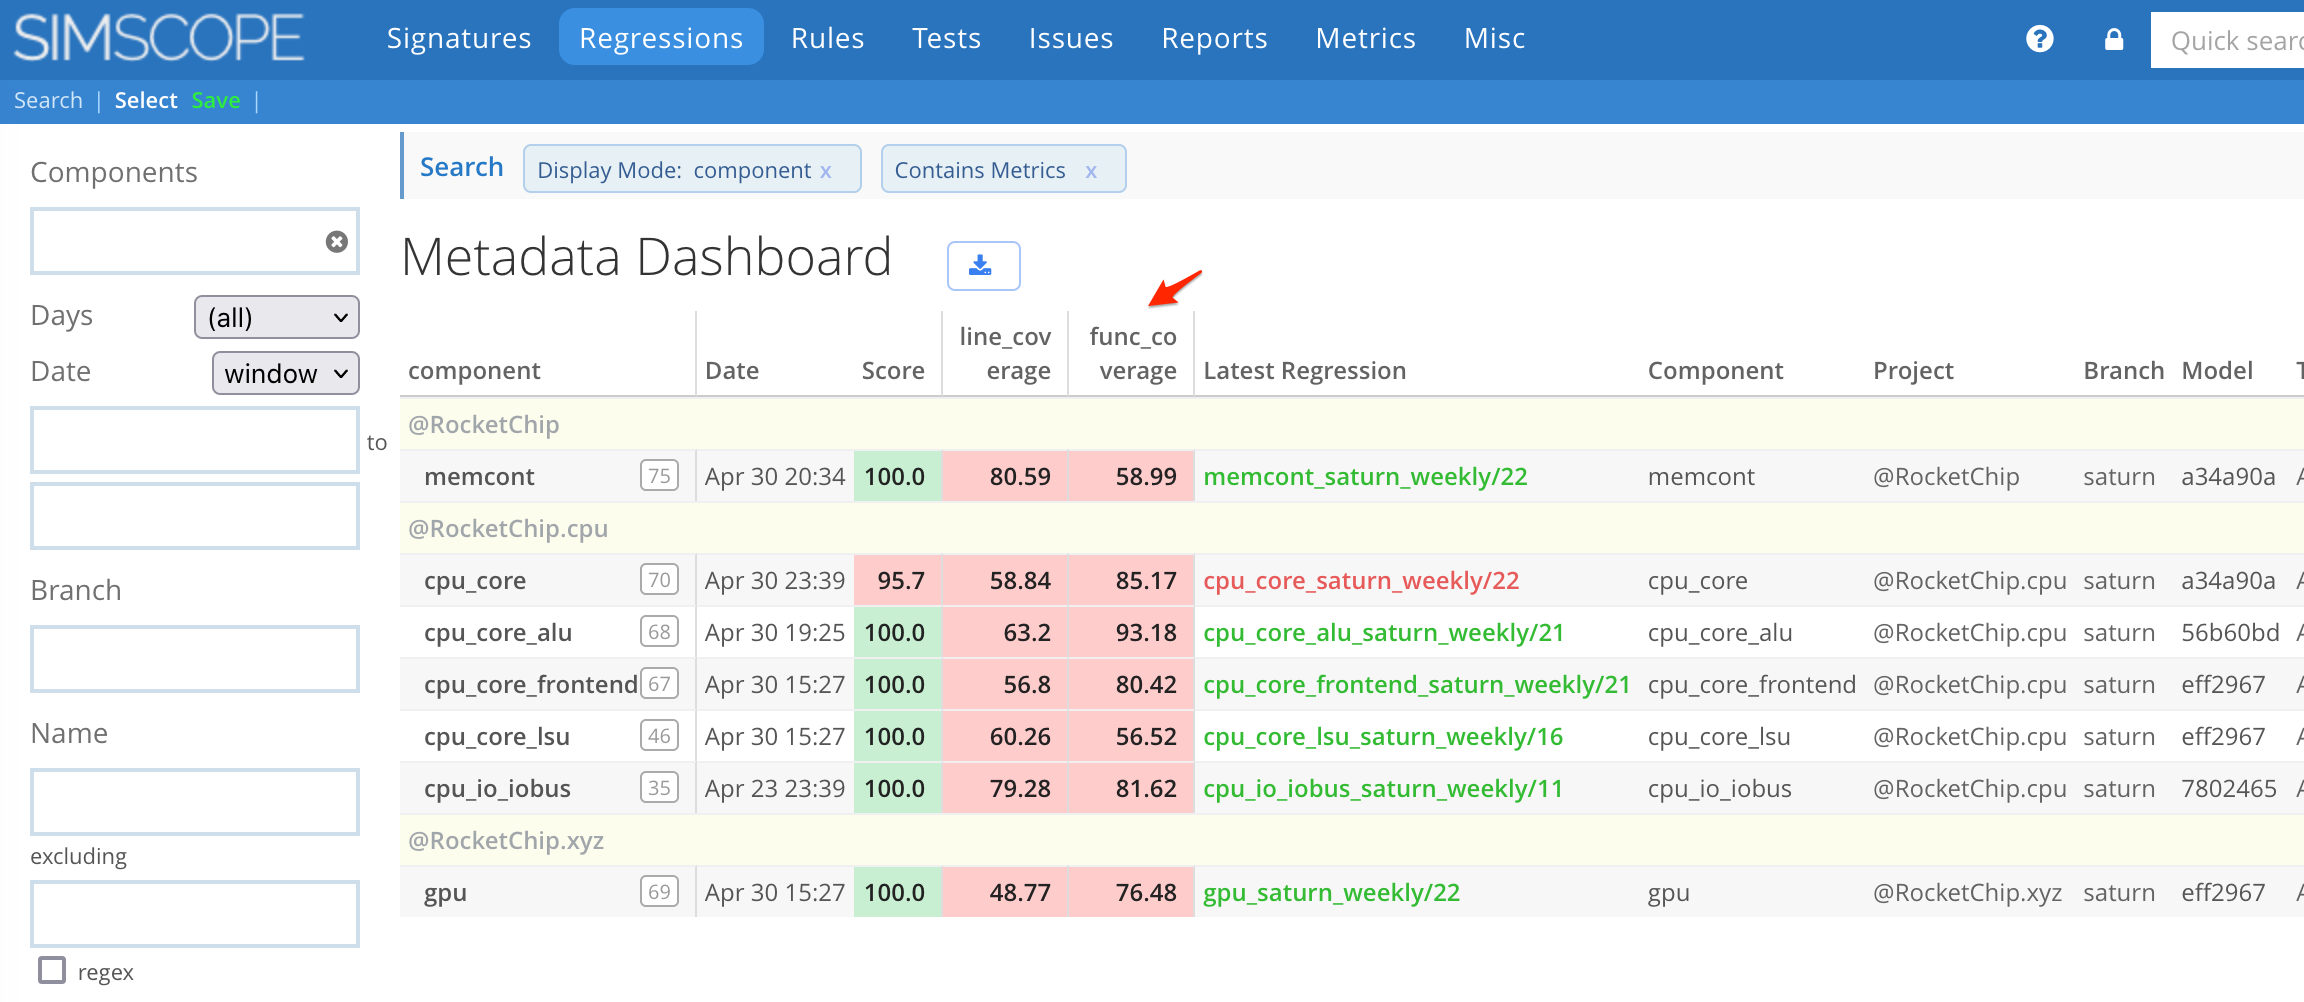
Config example
This simscope.config configuration sets the
func_coverage, line_coverage, and score fields to be:
- Green if greater than or equal to 95%, 97%, and 98% respectively
- Red otherwise
[fieldcolor "func_coverage"]
# Turn off blending between colors
noblend = true

color = "0.0  #ffcccc"  # red
color = "0.95 #c8efd1"  # green

[fieldcolor "line_coverage"]
# Turn off blending between colors
noblend = true

color = "0.0  #ffcccc"  # red
color = "0.97 #c8efd1"  # green

[fieldcolor "score"]
# Turn off blending between colors
noblend = true

color = "0.0  #ffcccc"  # red
color = "0.98 #c8efd1"  # green