Simscope Release History — v300 — 309
1.309
1. feature Simscope dashboard template
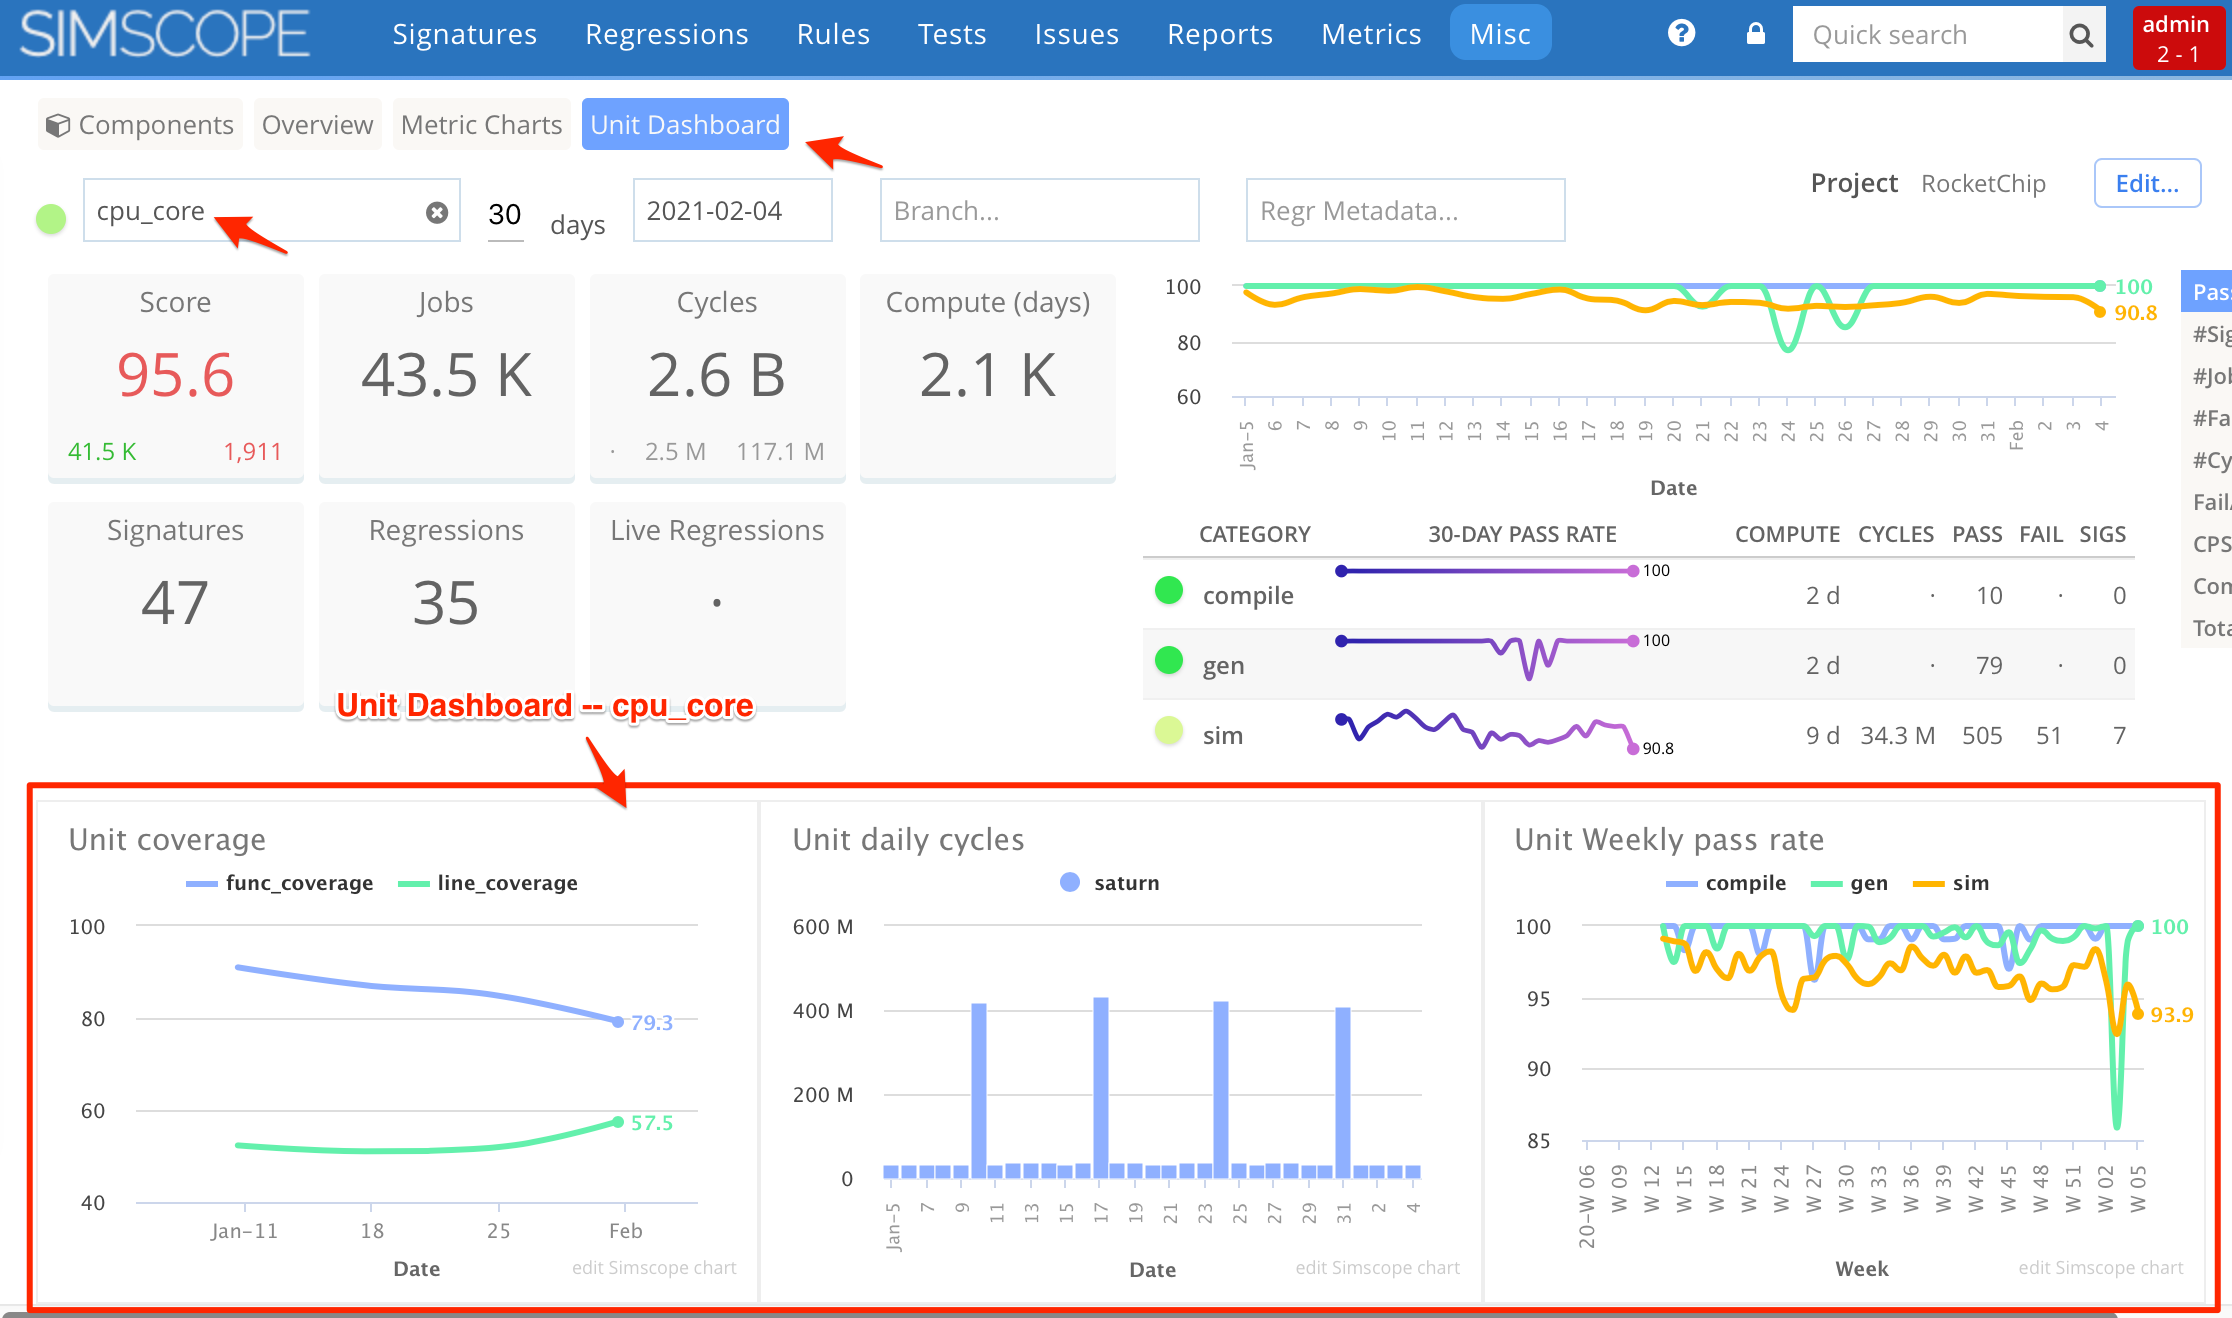
Simscope now allows a global Dashboard template to be set on the component view page.
For example, you can create a single Unit Dashboard, which will dynamically switch
all its charts, to the current unit selected by the user.
Here is an example where the dashboard is showing cpu_core data:
Enabling a custom dashboard template
→ To enable a Component dashboard template:
-
Create a Dashboard (with any name), with between one and twelve charts.
- Note: You can modify this dashboard later on if you want to make changes to the chart templates.
-
Add this to your
simscope.configfile.
[chart]
# Dashboard Template enables a custom global dashboard template, used on the
# component dashboard page.
dashboardtemplate = "username/Unit Dashboard"
- Restart Simscope.
2. change extid field
The prior Job field jobnum has been renamed to extid.
- This is an optional field, which can be used to store things like an LSF job ID into every job.
- This field requires Tunnel v1.24 or later.
3. bugfix simscope-jira-update fixes
The plugin simscope-jira-update.py has been fixed to support Python 3.5.
4. bugfix simscope apitoken fixes
The simscope apitoken command has been fixed to detect Simscope URL's with trailing slashes.
1.308
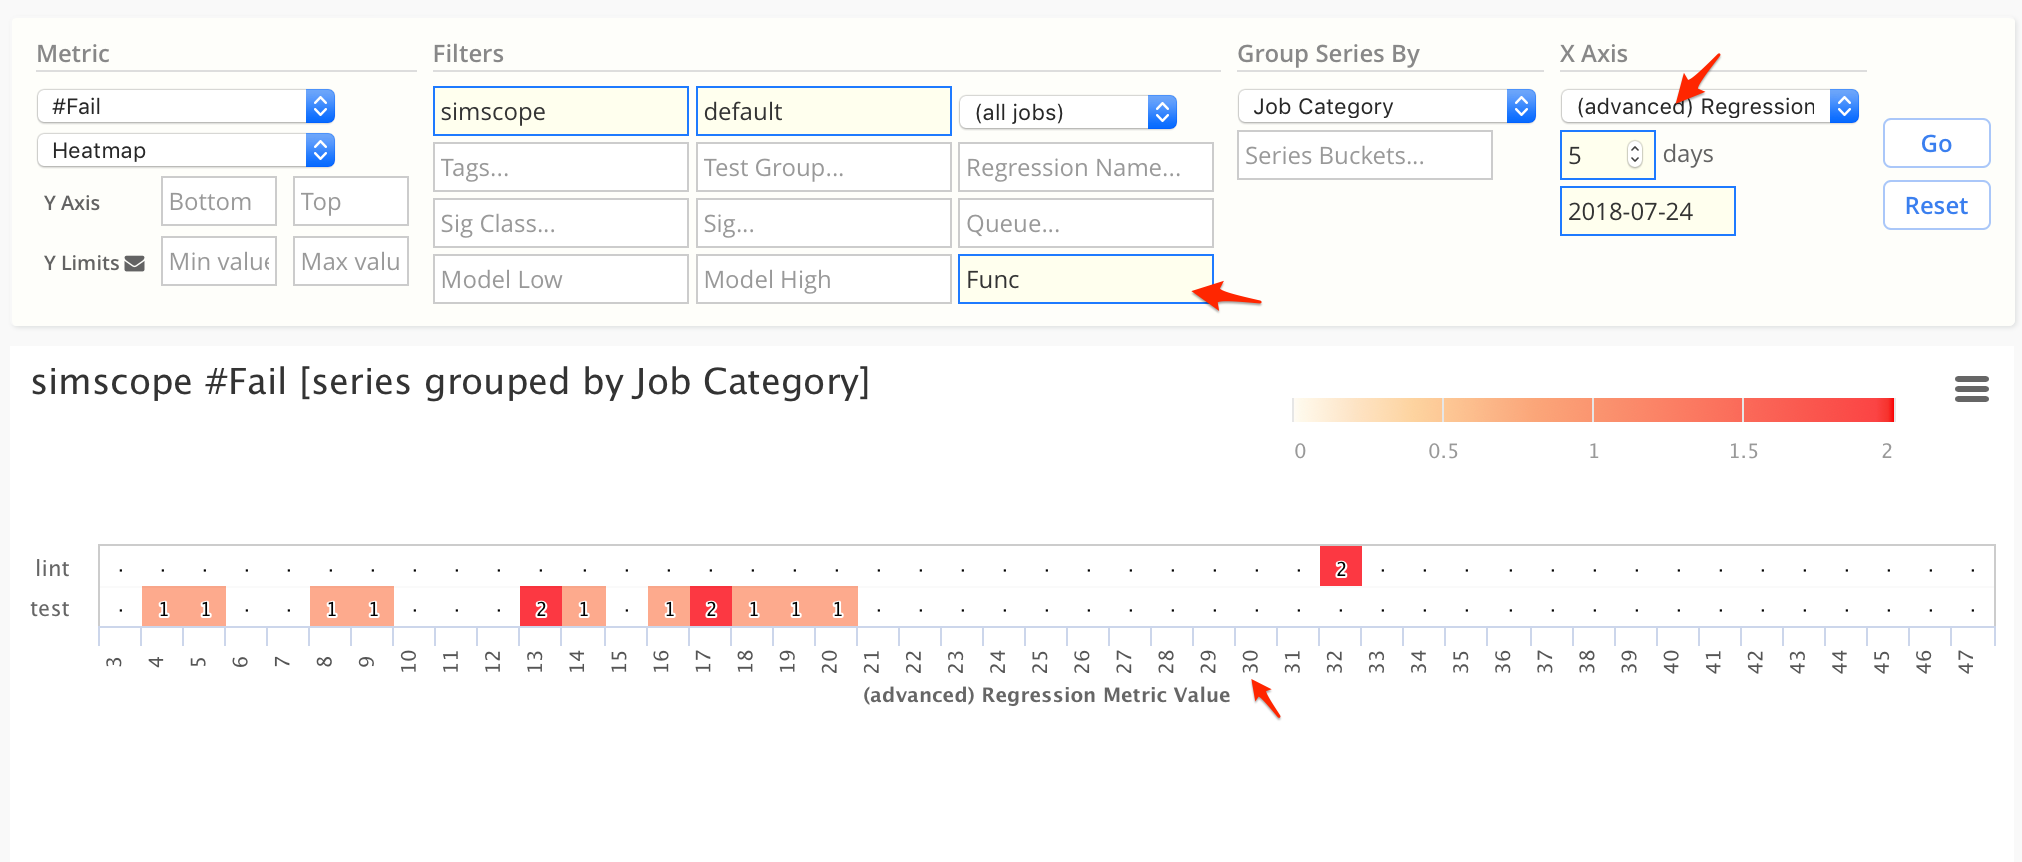
feature Advanced chart: X-axis by Regression Metric Value
This chart mode enables the following scenario:
- Store a Perforce changelist number metadata value inside a regression
- Create a heatmap of regression Fails (or Pass Rates), where the X-axis is keyed by Perforce changelist
- Group Y-axis by regression name
1.307
1. feature View regression metadata in regression search
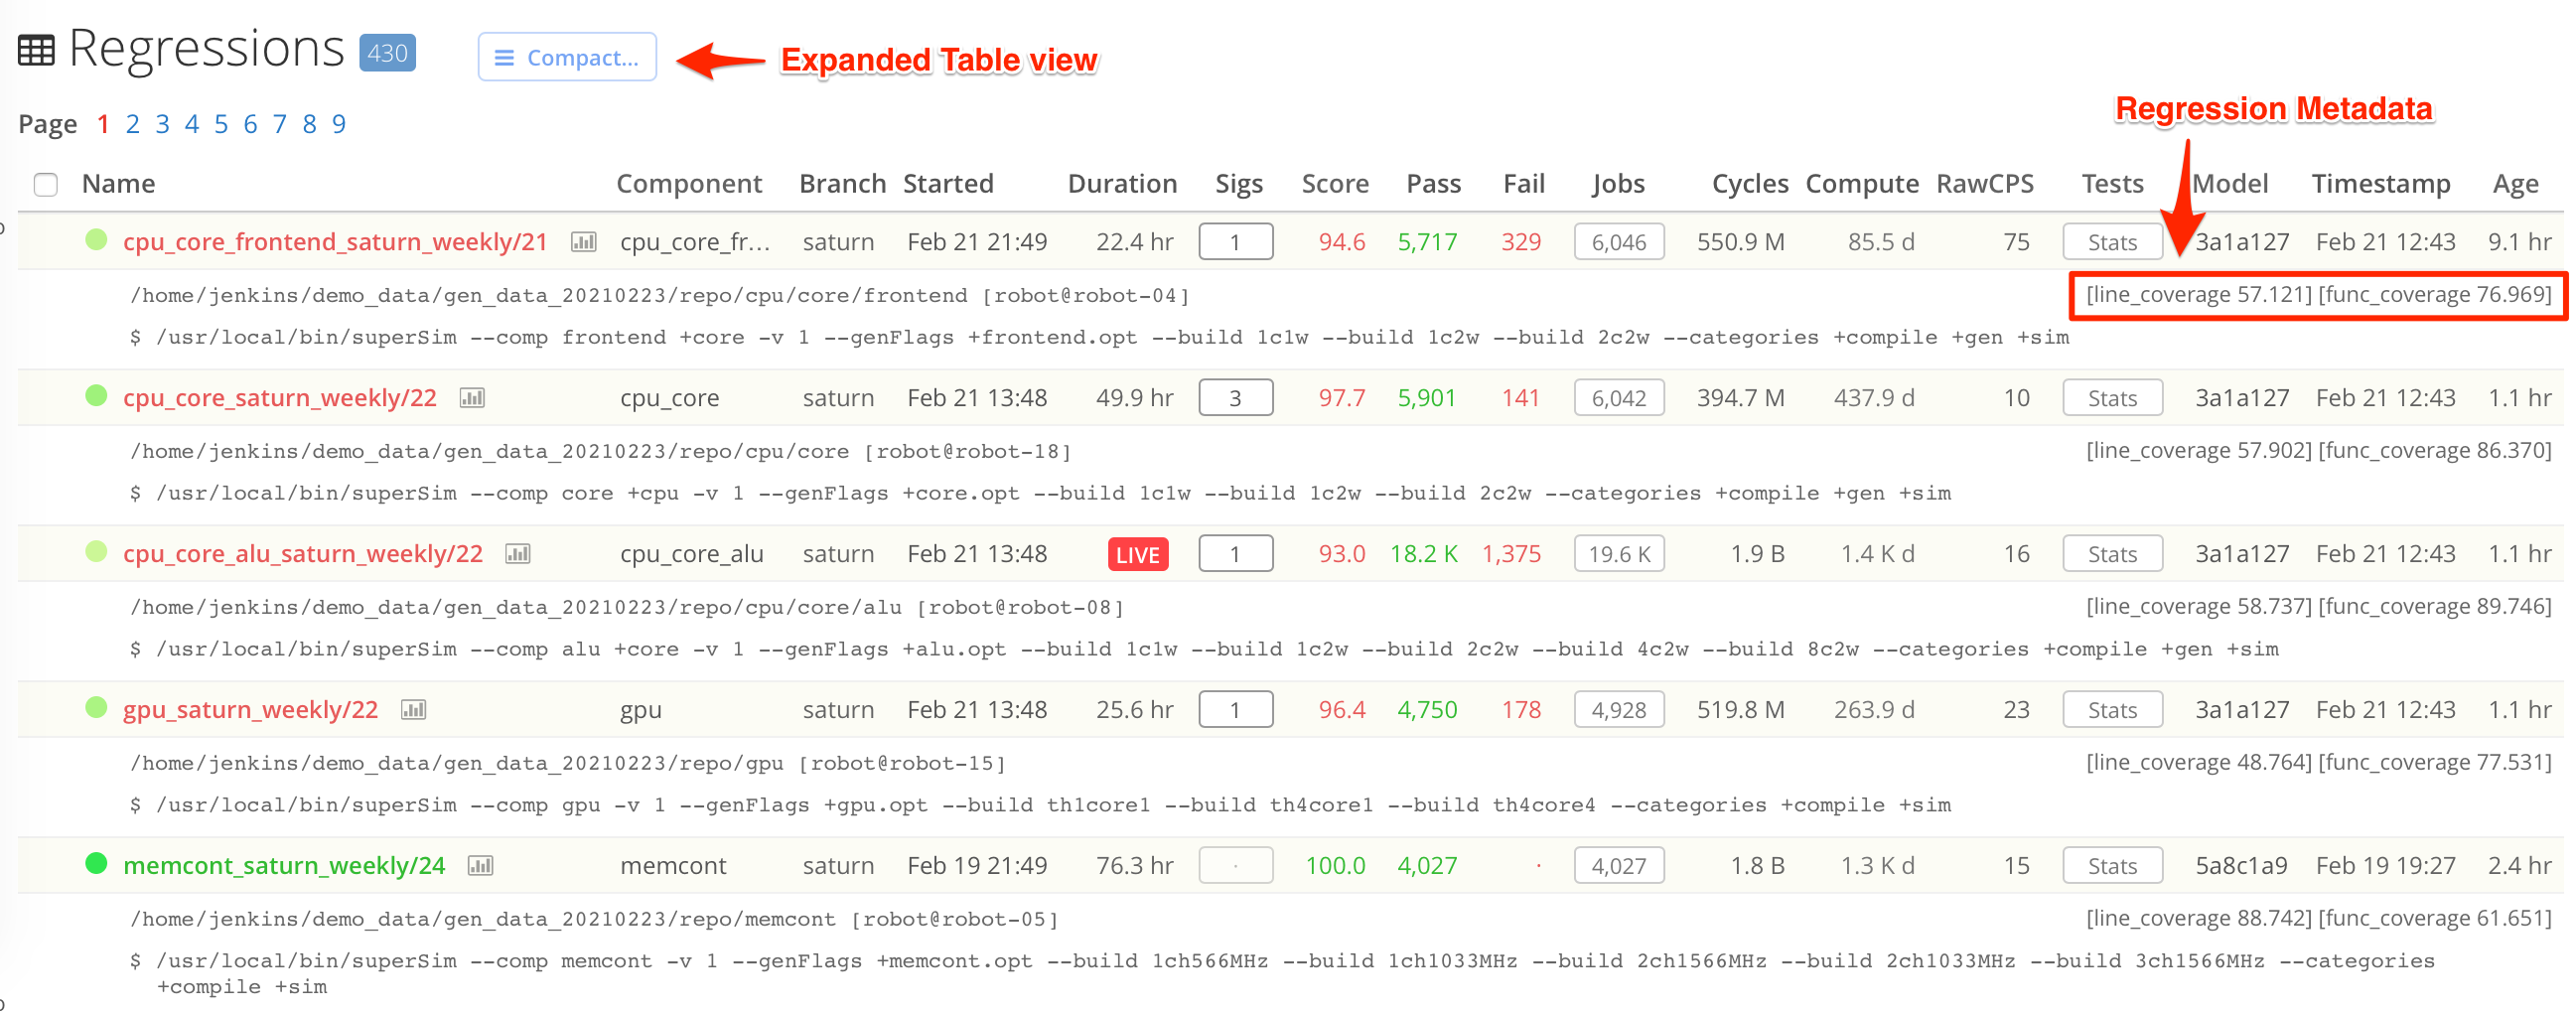
For debugging, Regression Metadata now renders inline in the regression search table.
- Note: you need to click the 'Expand' button to toggle this display.
Example:
- Regression
cpu_core_frontend_saturn_weekly/21hasline_coverage=57.121
2. bugfix Heatmap drilldown
The heatmap drilldown now uses a pointer cursor icon, to indicate clicking will open a link.
3. bugfix Category score percentage
Followup bugfix from v1.306: the category score Javascript code is now fixed to use fixed-percentage scores.
1.306
1. feature Hide ABORTED regressions
Simscope now has three filtering modes for regressions:
- Show all regressions (default)
- Show only
ABORTEDregressions - Hide
ABORTEDregressions
2. feature Fixed-digit percentage scoring
For regressions and test statistics, switched from baseball-style scoring (three digit decimal) to fixed-digit percentage scoring.
- Basically this just moves the decimal point two digits to the right (and omits leading zeroes), so the score looks like a percentage.
Examples of old/new scores:
| Baseball (old) | Percentage (new) |
|---|---|
1.000 | 100.0 |
.999 | 99.9 |
.500 | 50.0 |
.051 | 5.1 |
.010 | 1.0 |
.001 | 0.1 |
.000 | 0.0 |
3. bugfix Heatmap drilldown
Heatmap charts with daily time periods can now drill down to see matching regressions.
- This makes debugging values in heatmaps easier.
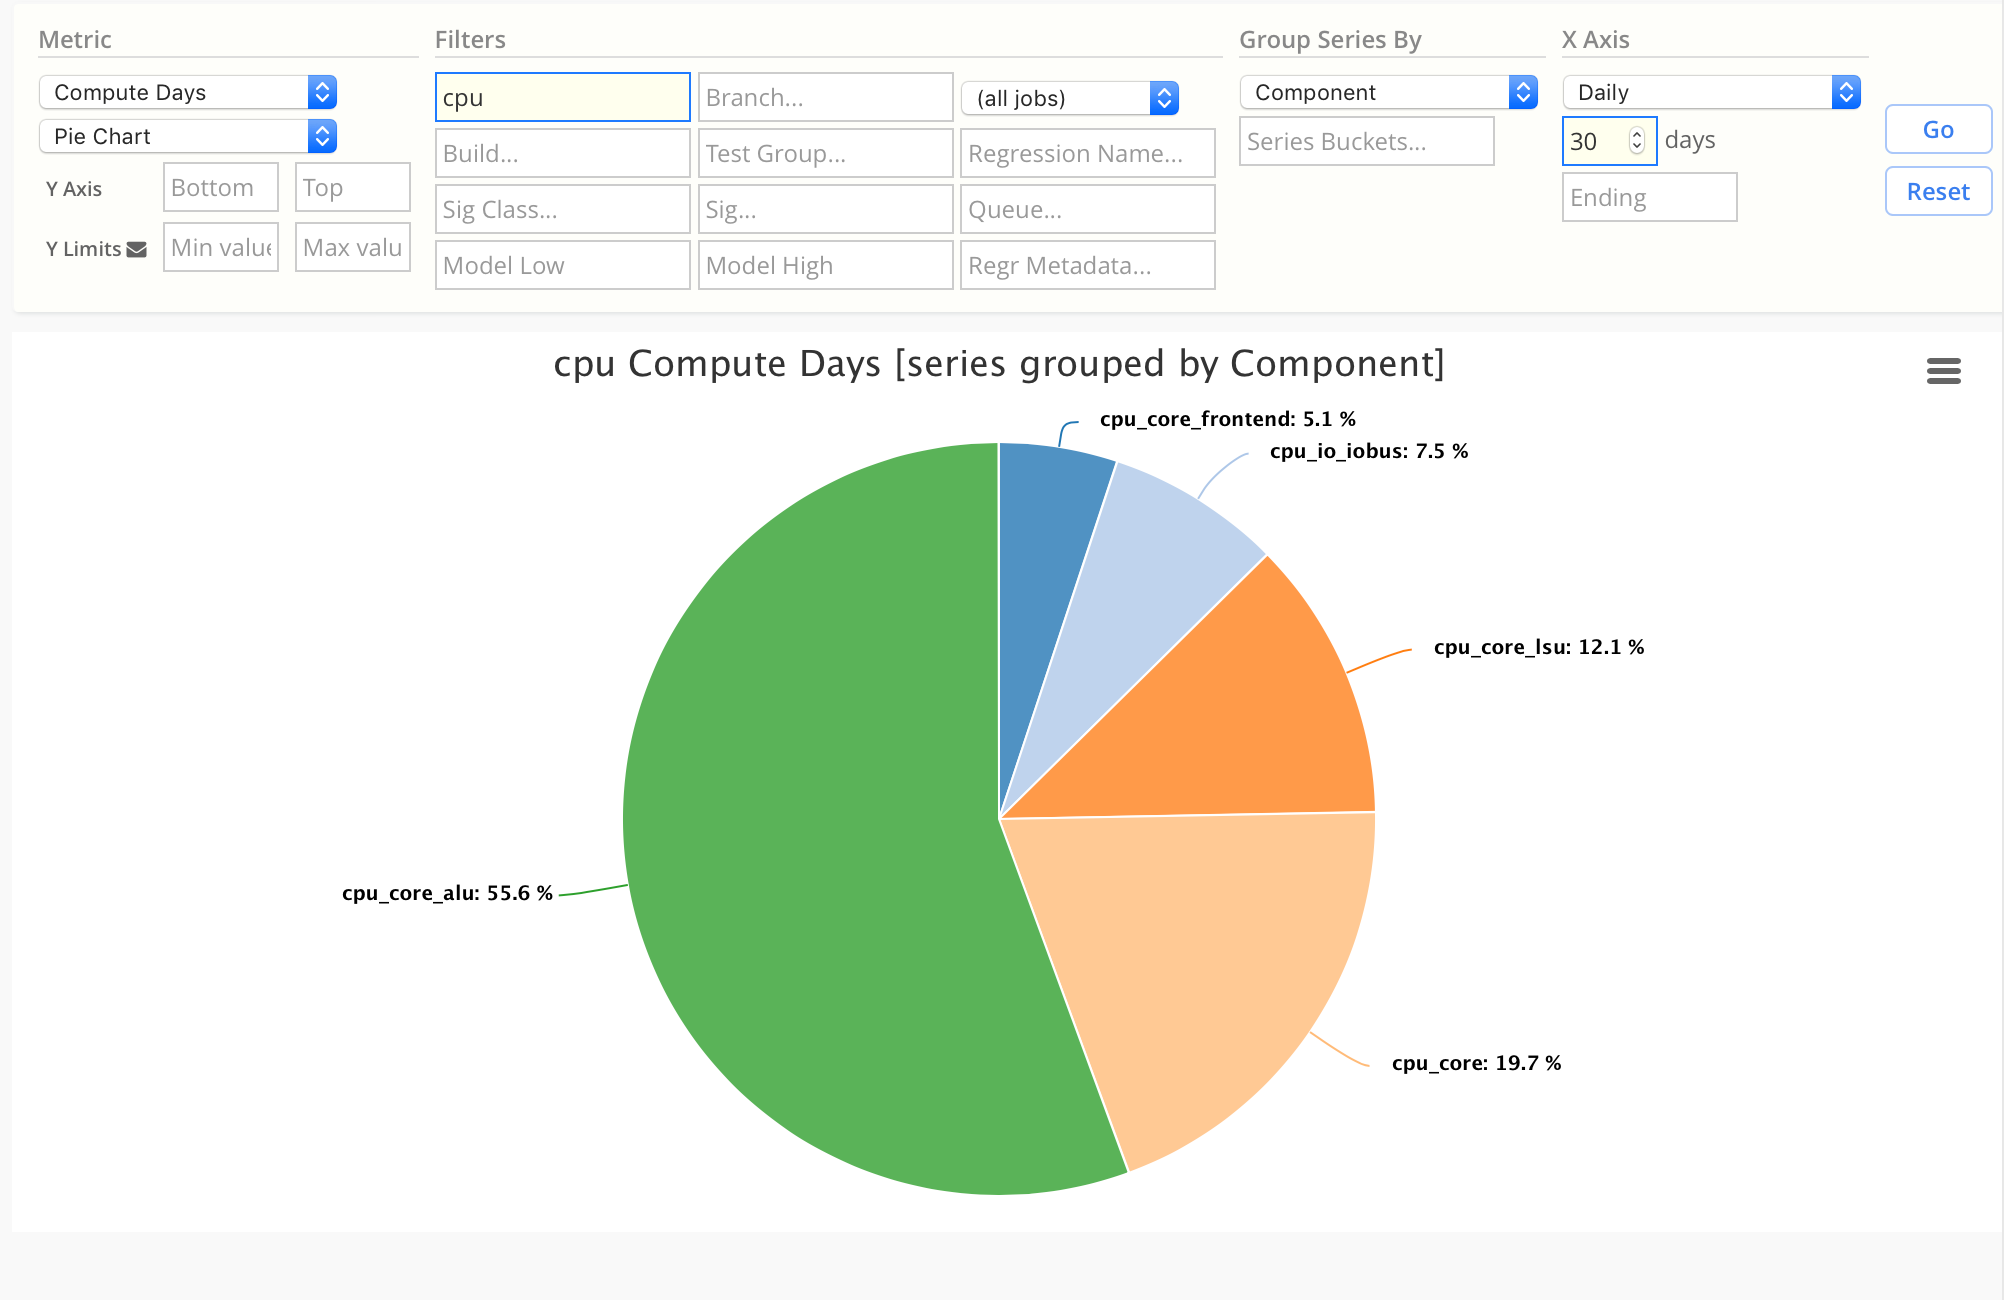
4. bugfix Pie chart largest-to-smallest
Pie charts now render series in largest-to-smallest order.
- The largest pie piece will always be in the north-east corner of the pie.
- The smallest pie piece will always be in the north-west corner of the pie.
Prior versions incorrectly rendered in smallest-to-largest order.
1.305
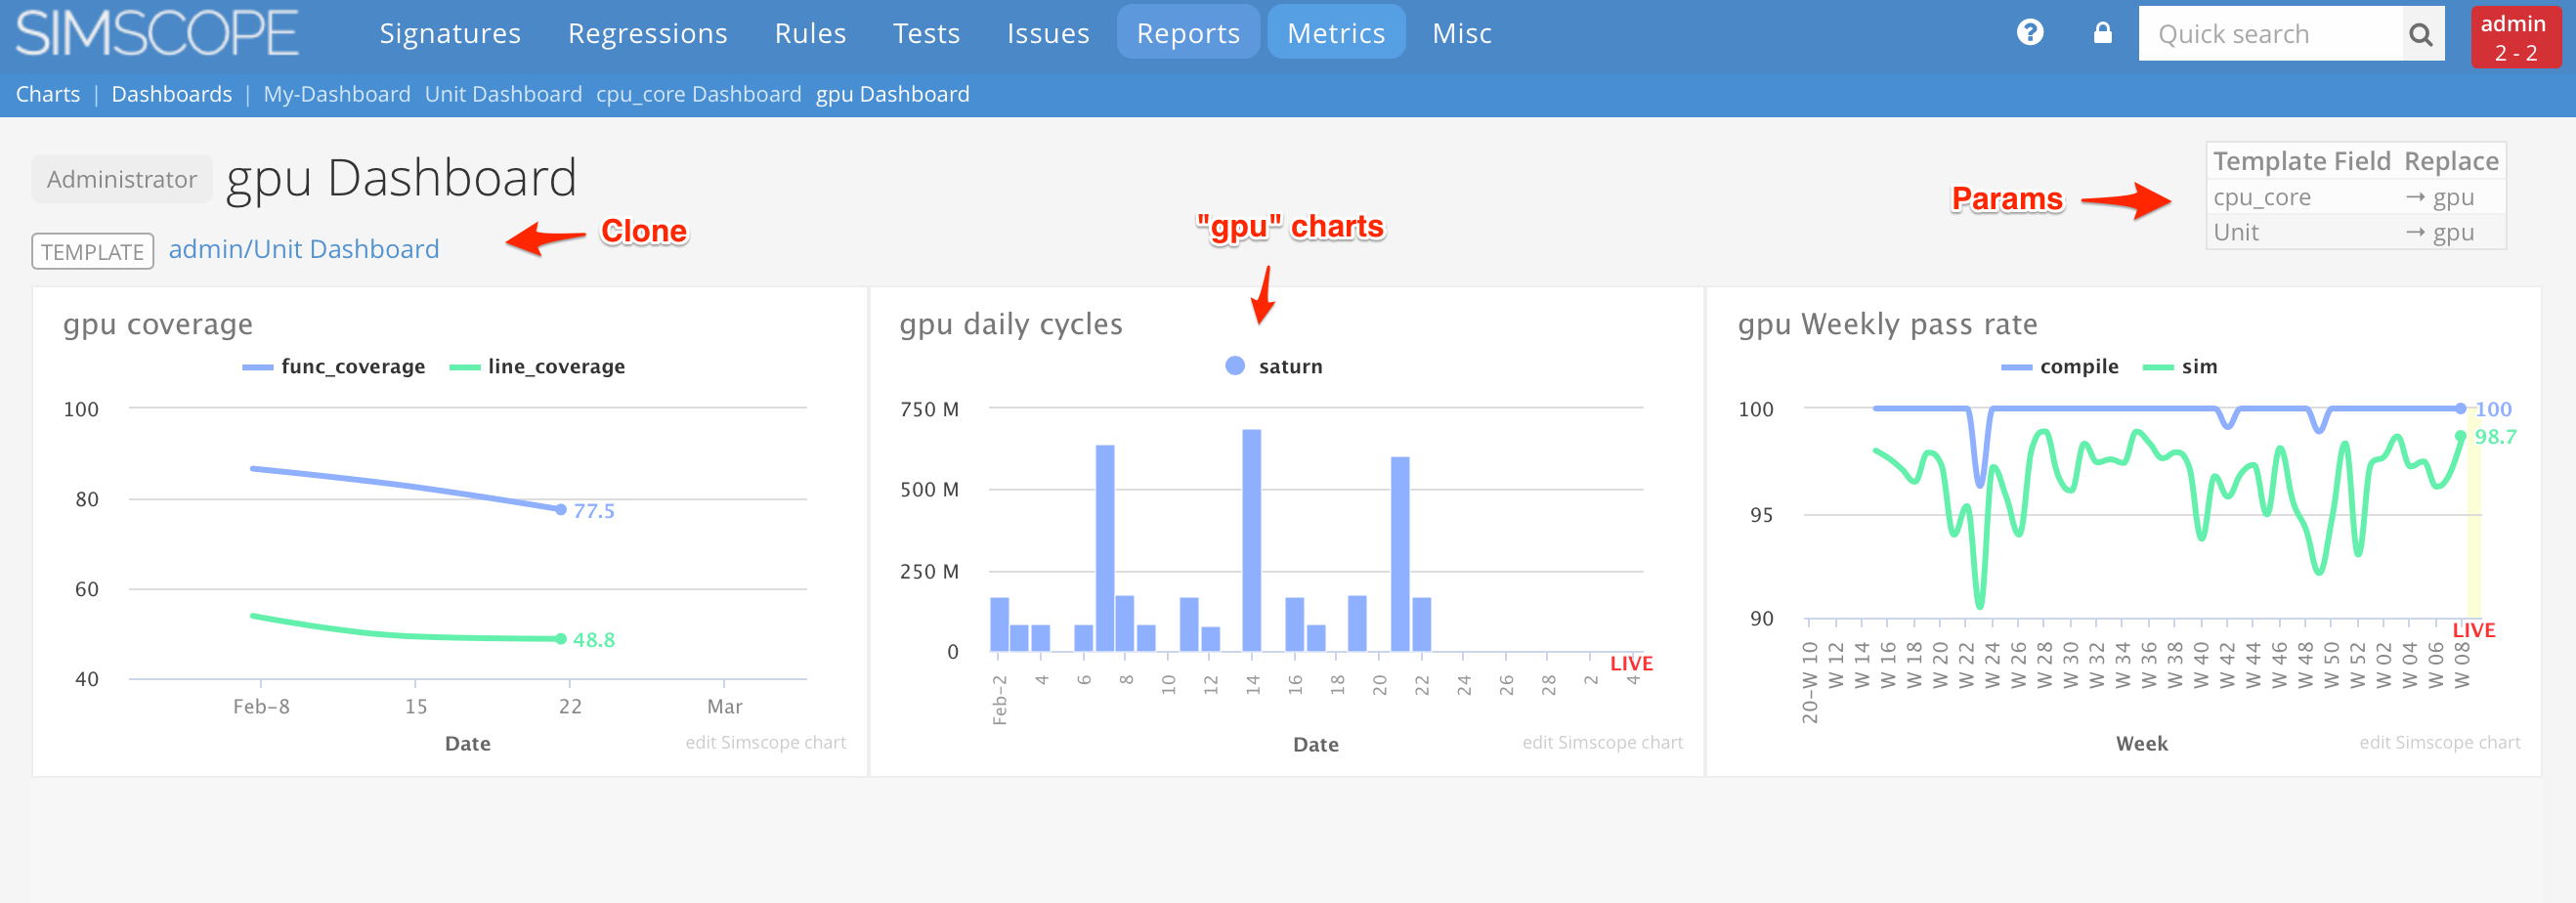
feature Dashboard Templates
BETA feature
→ Simscope Dashboards can now be used as templates, to clone child dashboards.
1.304
feature Pie Charts
→ Simscope can now render Pie charts.
1.303
1. feature Regression 'tag' field
Regressions now have an optional tag field, which can be used for marking a
string attribute on a regression. Tags can be changed on regressions after they
have started (or finished).
This can also be combined with CSS to render regressions with tags differently in the HTML.
2. feature Disk space check
Simscope now verifies at least 1 GB of disk space exists before job RabbitMQ imports.
If not enough space, imports will be paused until space is available.
This is to prevent possible data corruption if disk space has run out unexpectedly.
Here is an example warning:
[WARN ] Disk space too low → Pausing Simscope Rabbit import
path=/work/simscope/testdb available=0.8 GB
3. bugfix Component dashboard filter with metadata
The component dashboard page now filters charts by the metadata field (if it is not blank).
4. bugfix Heatmap abbreviation
Heatmap charts with long series names now abbreviate properly (with ... ellipses).
5. bugfix Stacked Area chart with single point
Stacked Area charts with single X-axis point are now rendered correctly.
1.302
feature Duplicate job detection update
The Duplicate (alias) job detection algorithm (during regression import) now uses compute-time value to match against duplicates, in addition to the prior field checks.
1.301
feature Component dashboard improvements
The component dashboard now includes:
- Components are matched via regular expressions, so multiple components can be viewed simultaneously
- Example:
alpha|betamatches two components - Example:
projmatches all components withprojin them (ie from the same project)
- Example:
- Regressions can be filtered by metadata field
- Example:
covmatches regressions containing acovmetadata field
- Example:
- bugfix Disabled components now show up properly, so they can be fixed.
1.300
1. feature Regression emails now show the model version field
Regression Fail emails now show the model version, so it's obvious which version has failed.
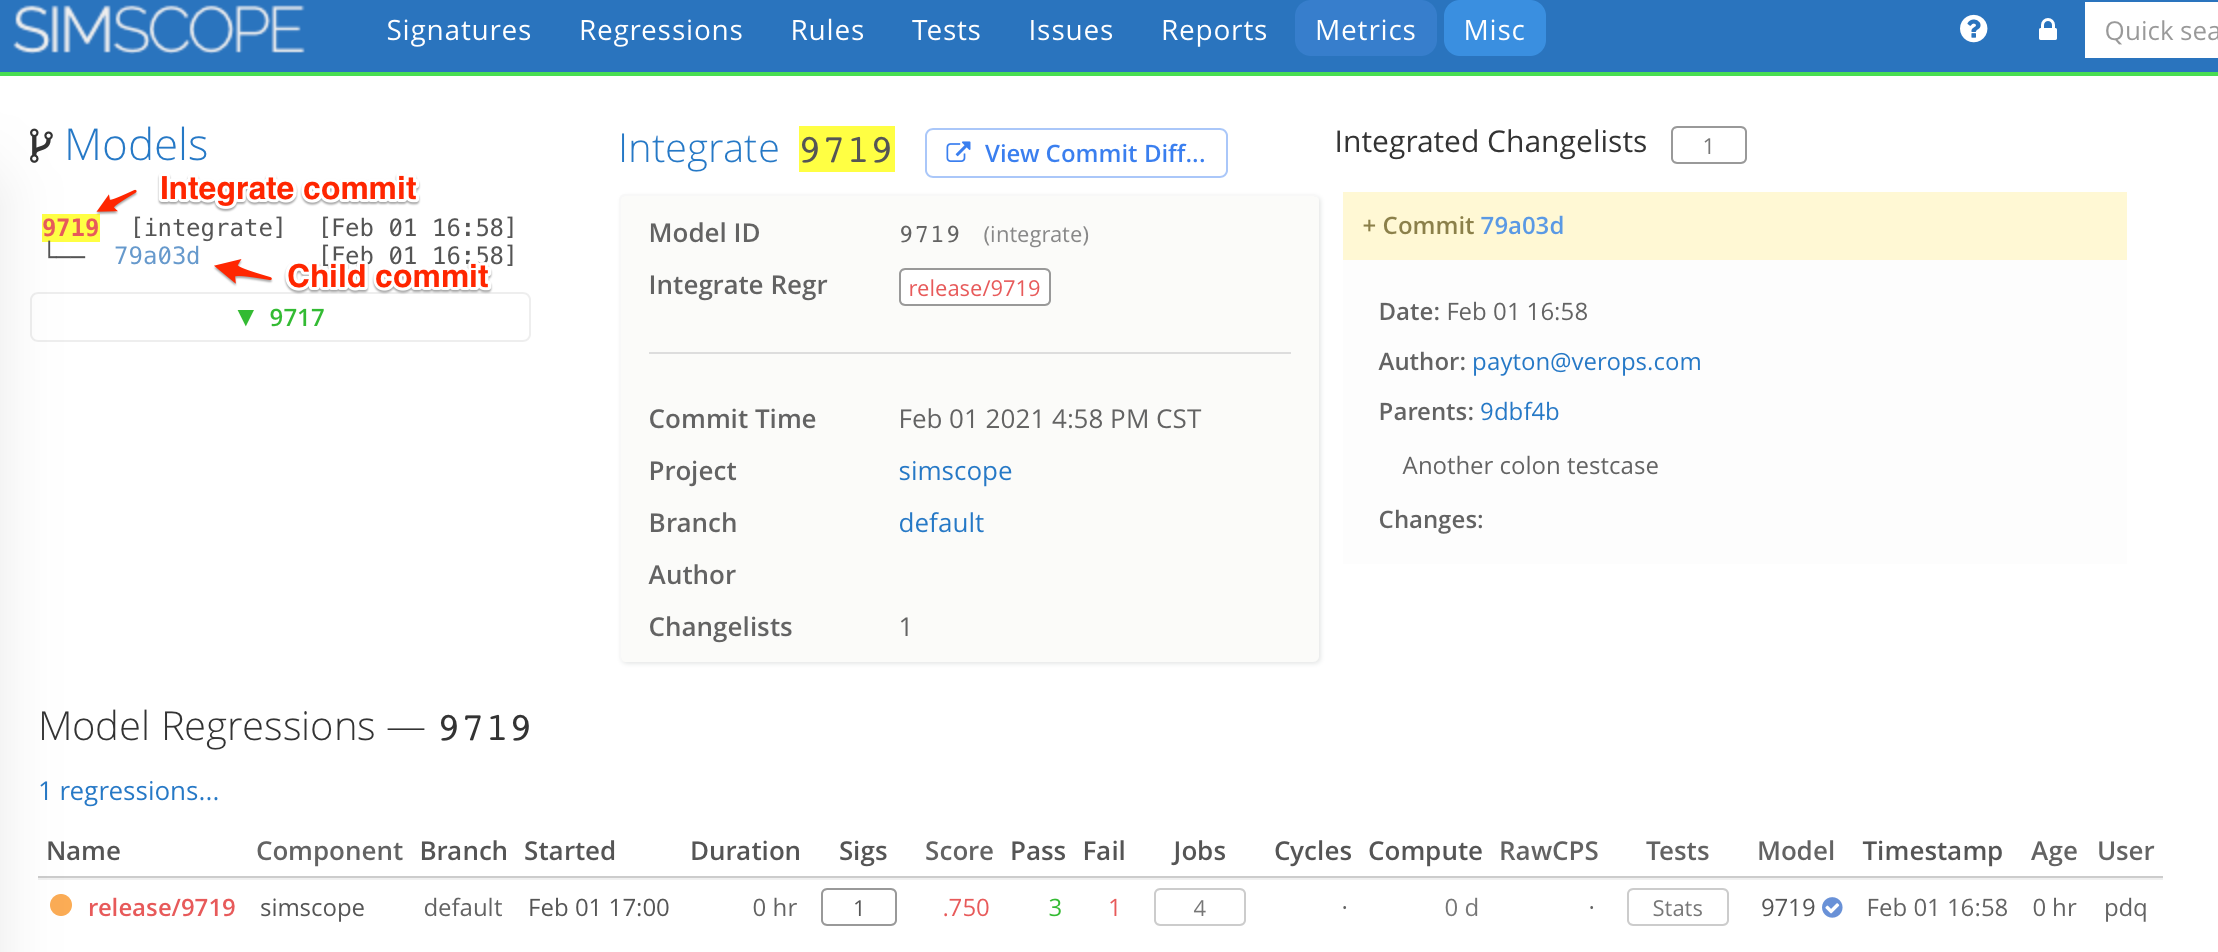
2. feature Model page improved
The model view page now shows a tree-style hierarchy, for integrates.
Here is an example, showing an integrate with a single child commit SHA:
3. bugfix Metadata values with colons work now
In previous versions, colon character would trigger Simscope to ignore this metadata value.
This has been fixed. Example:
mytags:tag1:tag2
