Coverage DB
NOTE: Simscope local coverage DB's are currently a beta feature.
Please contact payton@verops.com for help or more info...
Simpler alternative: Static HTML Coverage
Note: if you have static coverage HTML report files stored on disk, and only want to link to them from Regressions via JSON, you can use the much simpler Regression HTML Coverage Reports technique.
Intro
To enable and integrate coverage into Simscope, see the Data Integration page.
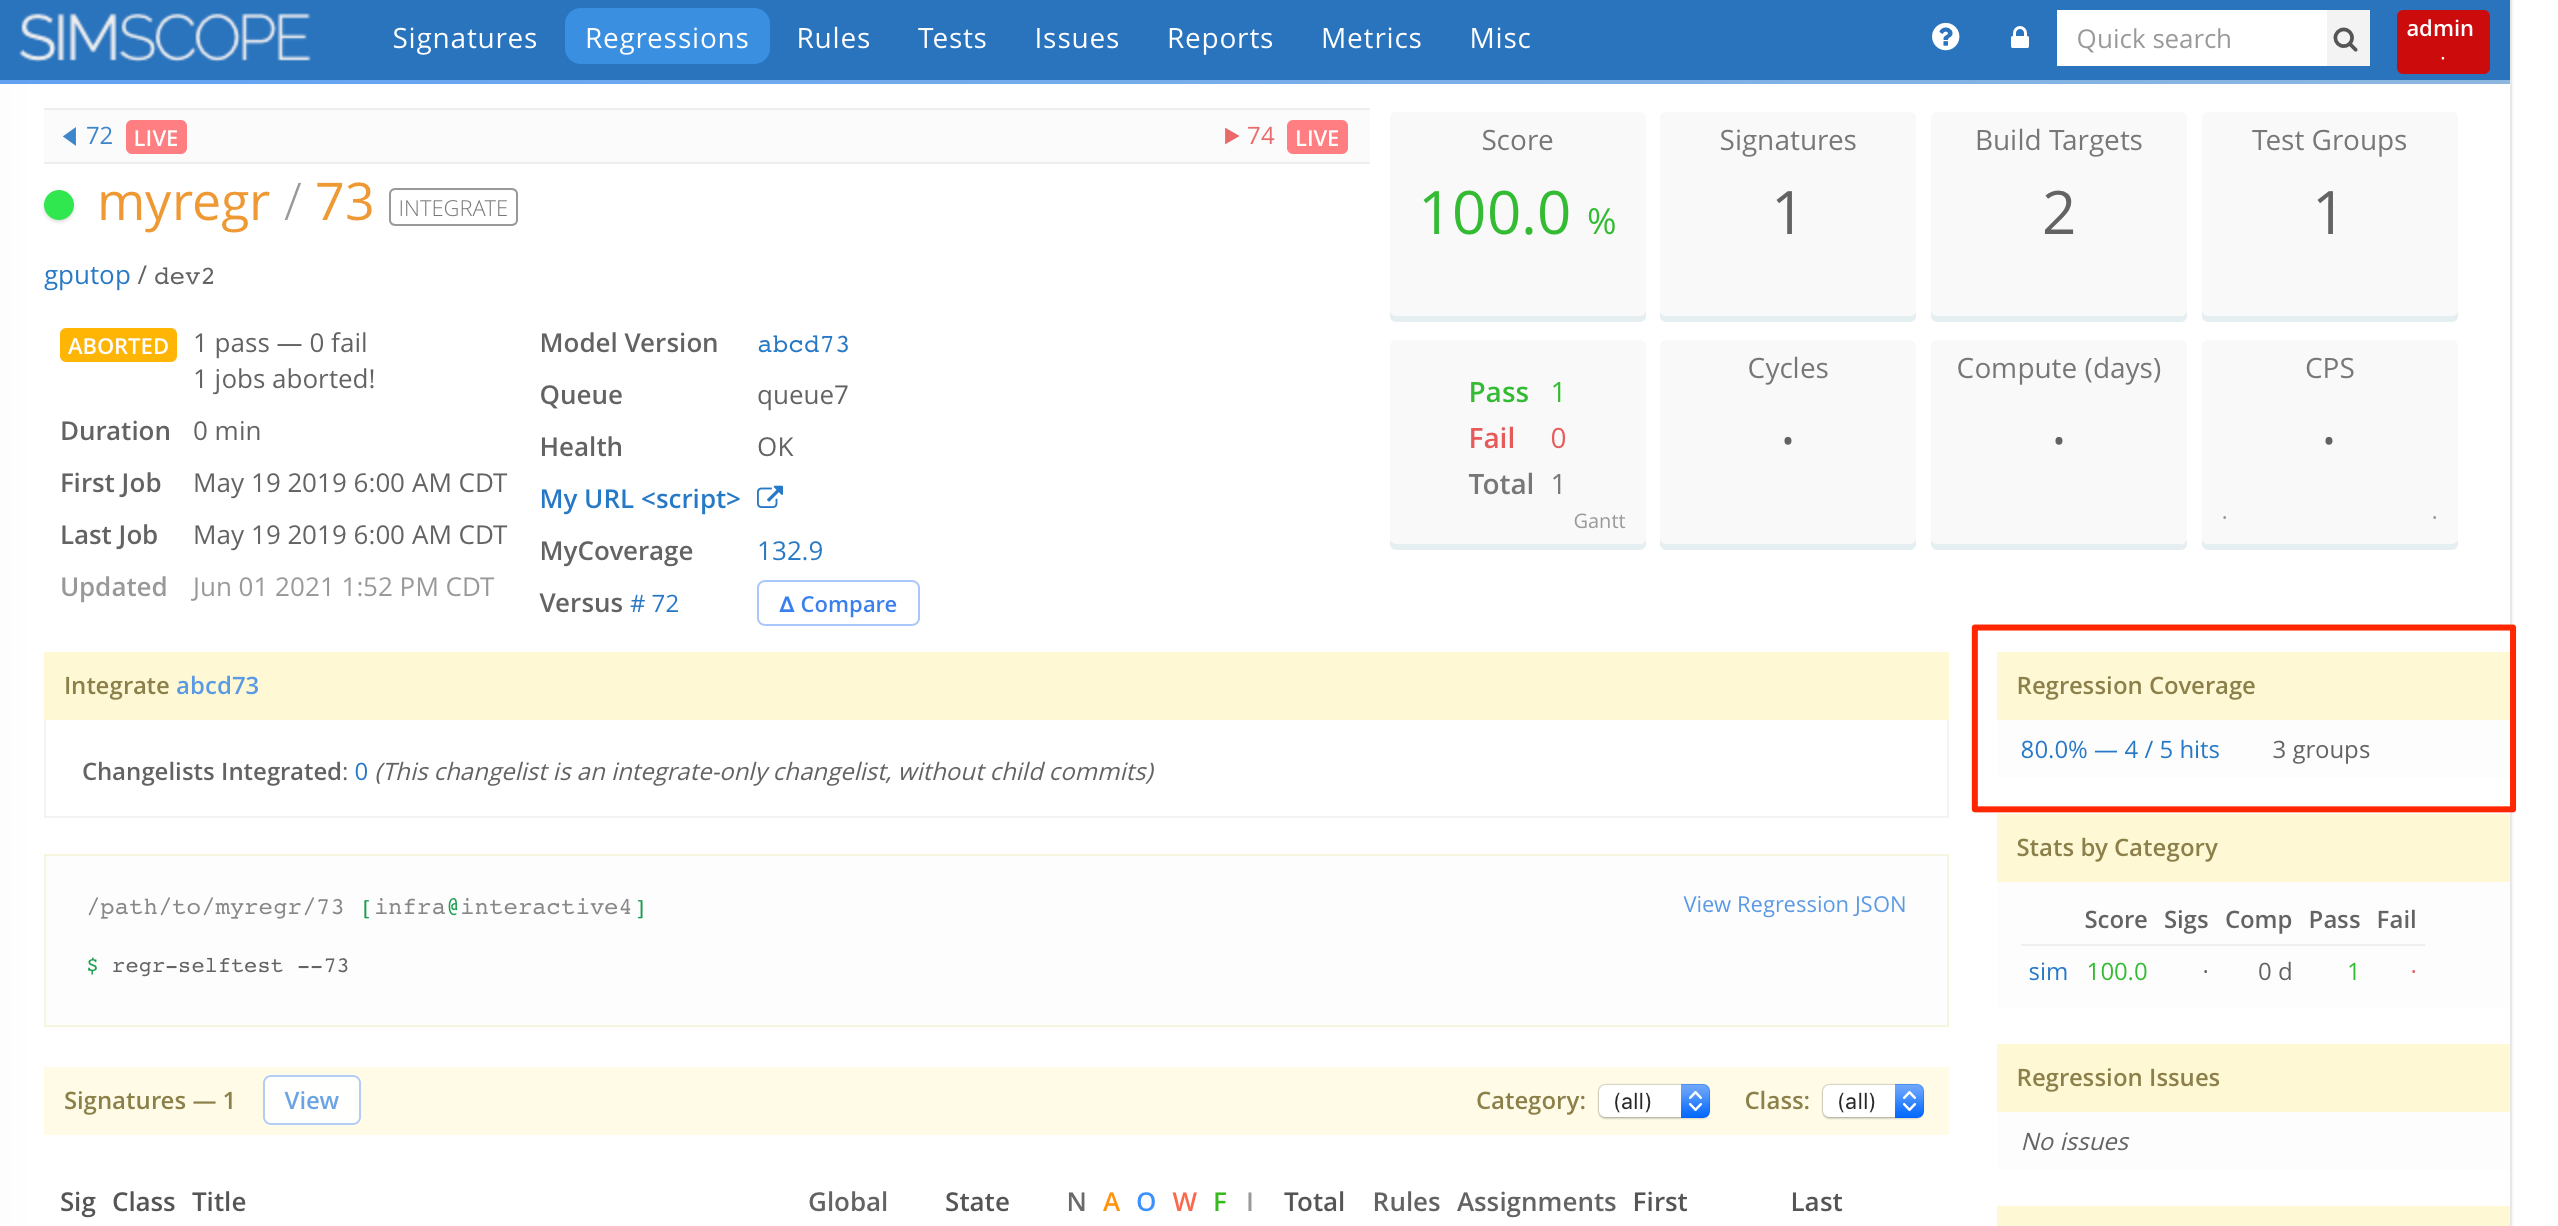
Regression Coverage
From a regression, you can link to a coverage model:
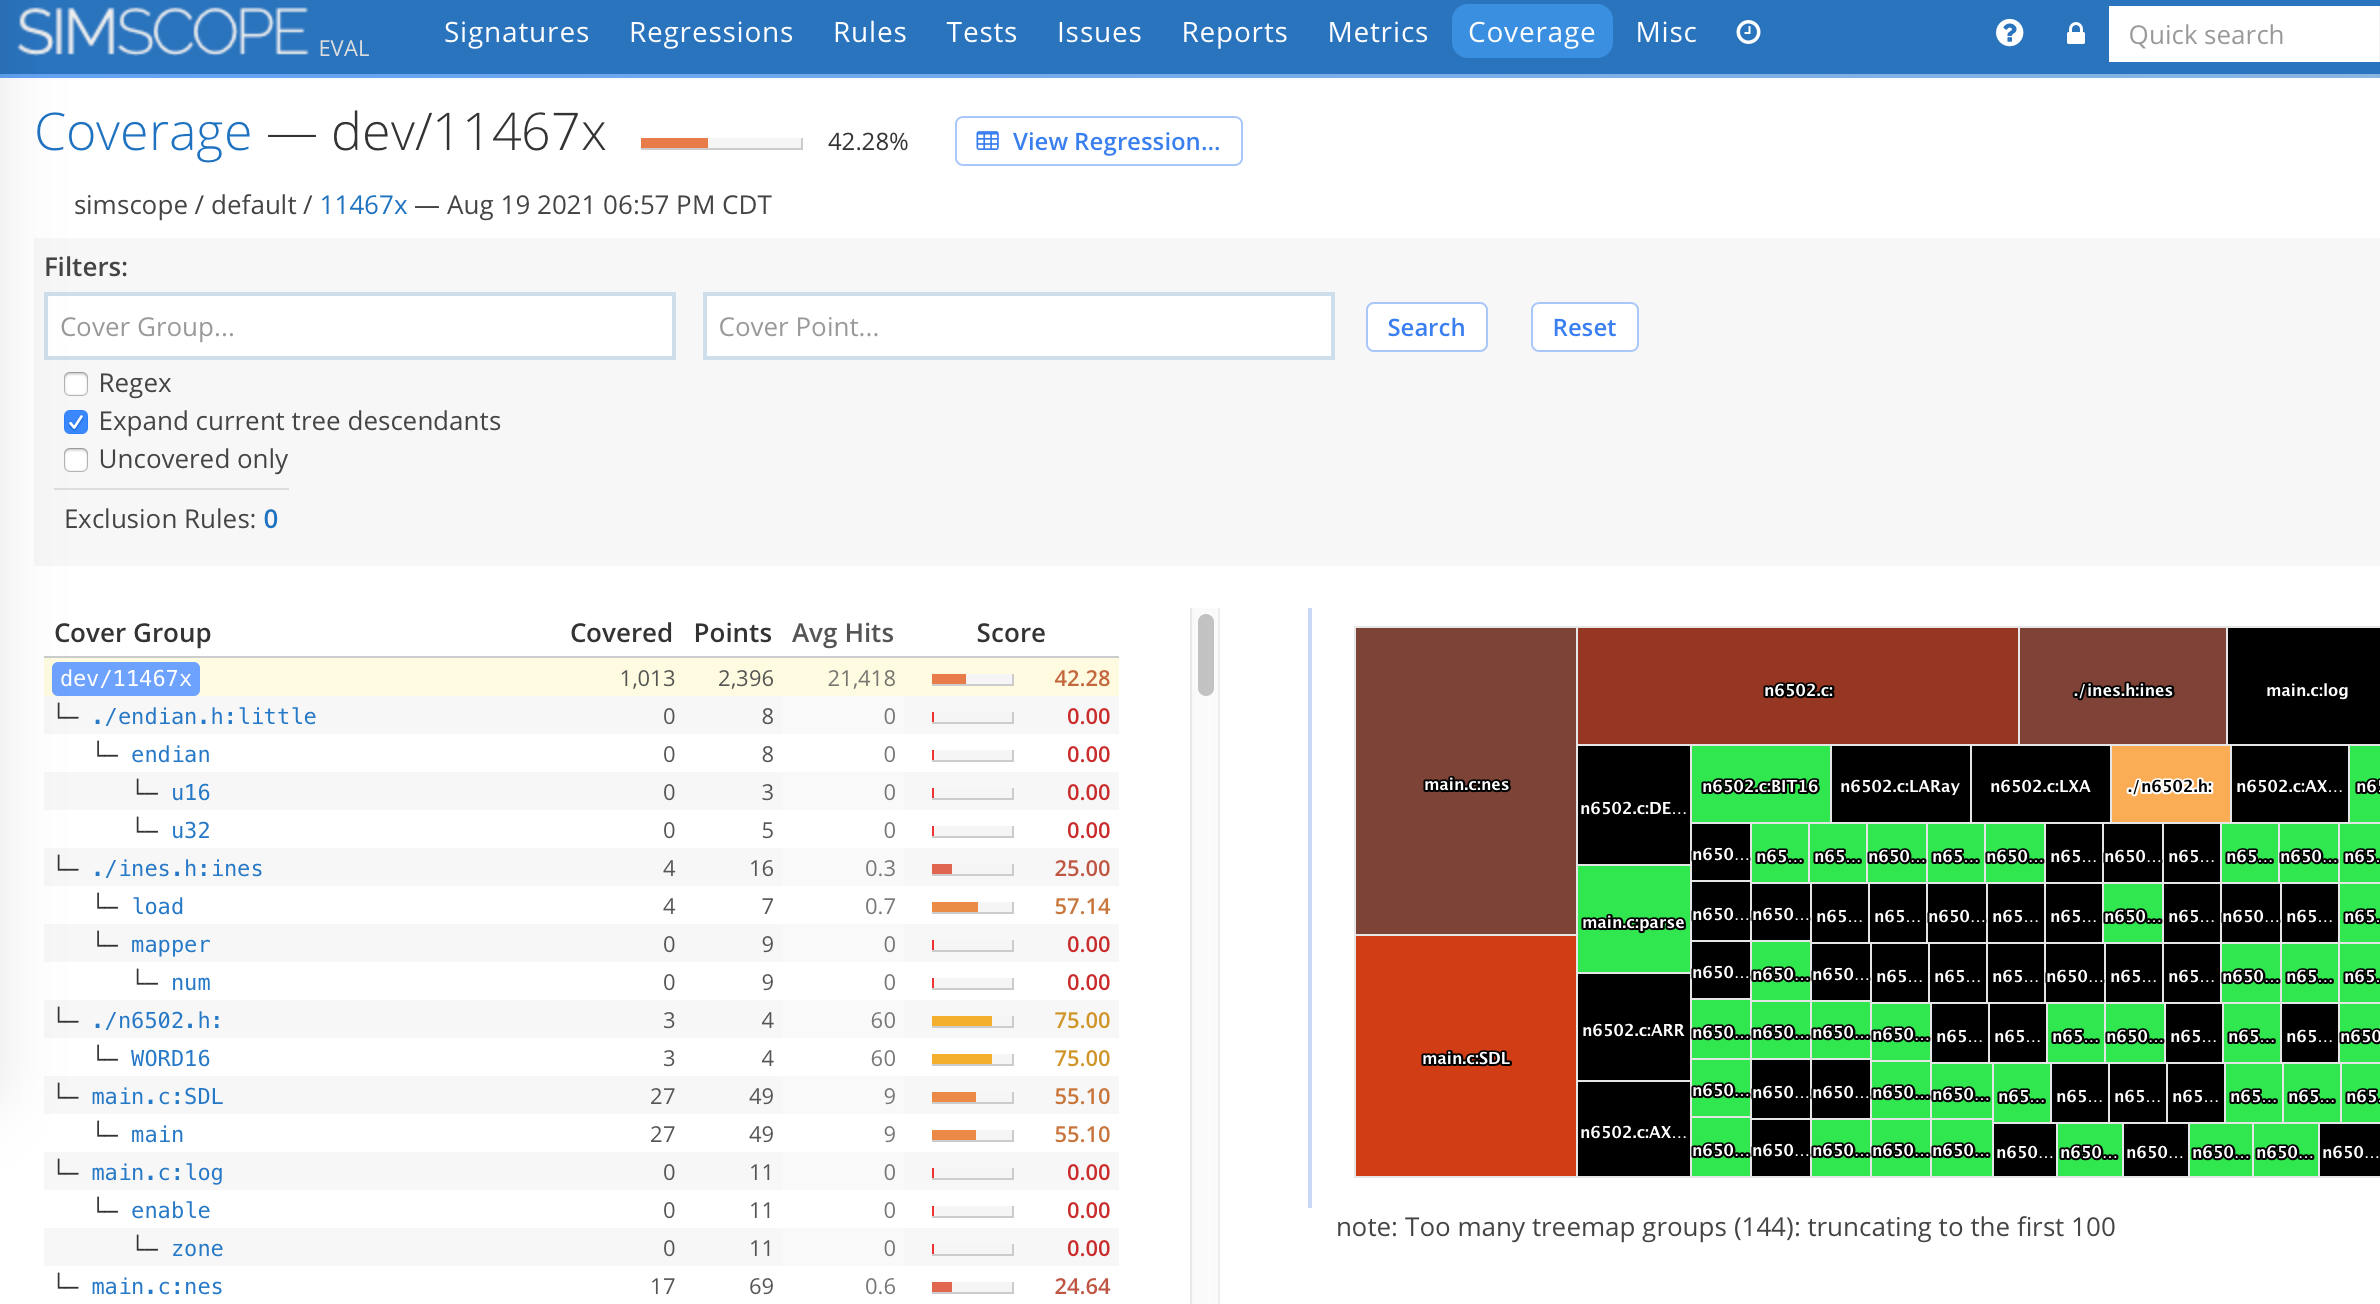
Hierarchical coverage
If groupseparator is enabled, Simscope can render hierarchical coverage, in a tree format.
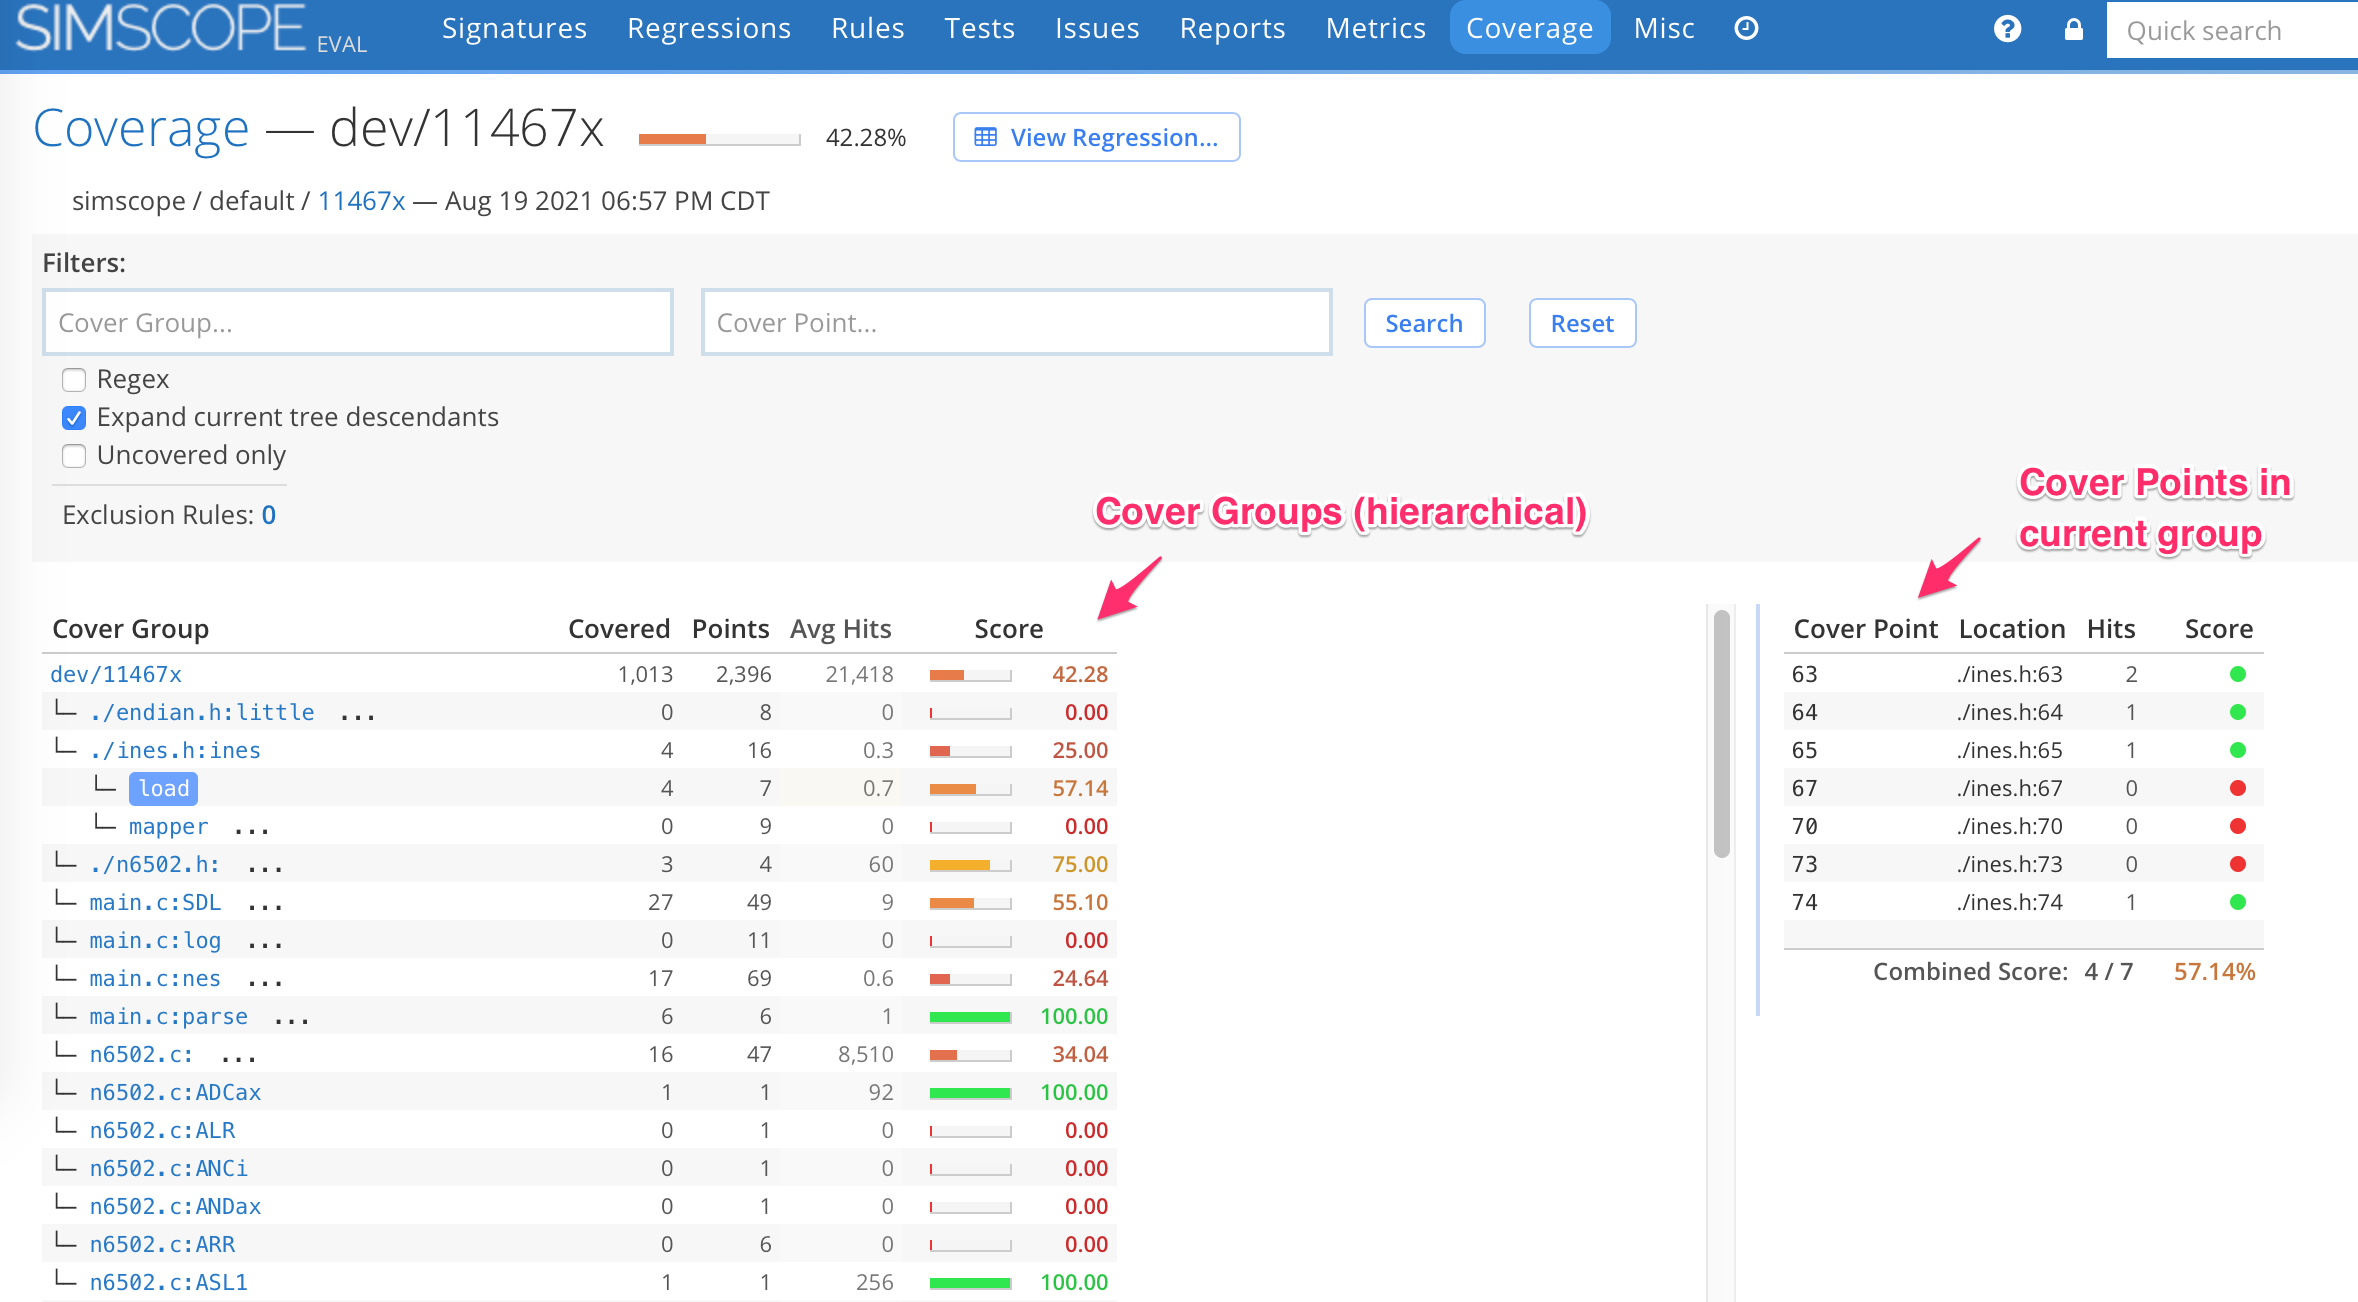
Example:
When drilling into a coverage group, it displays the group's coverage point summary.
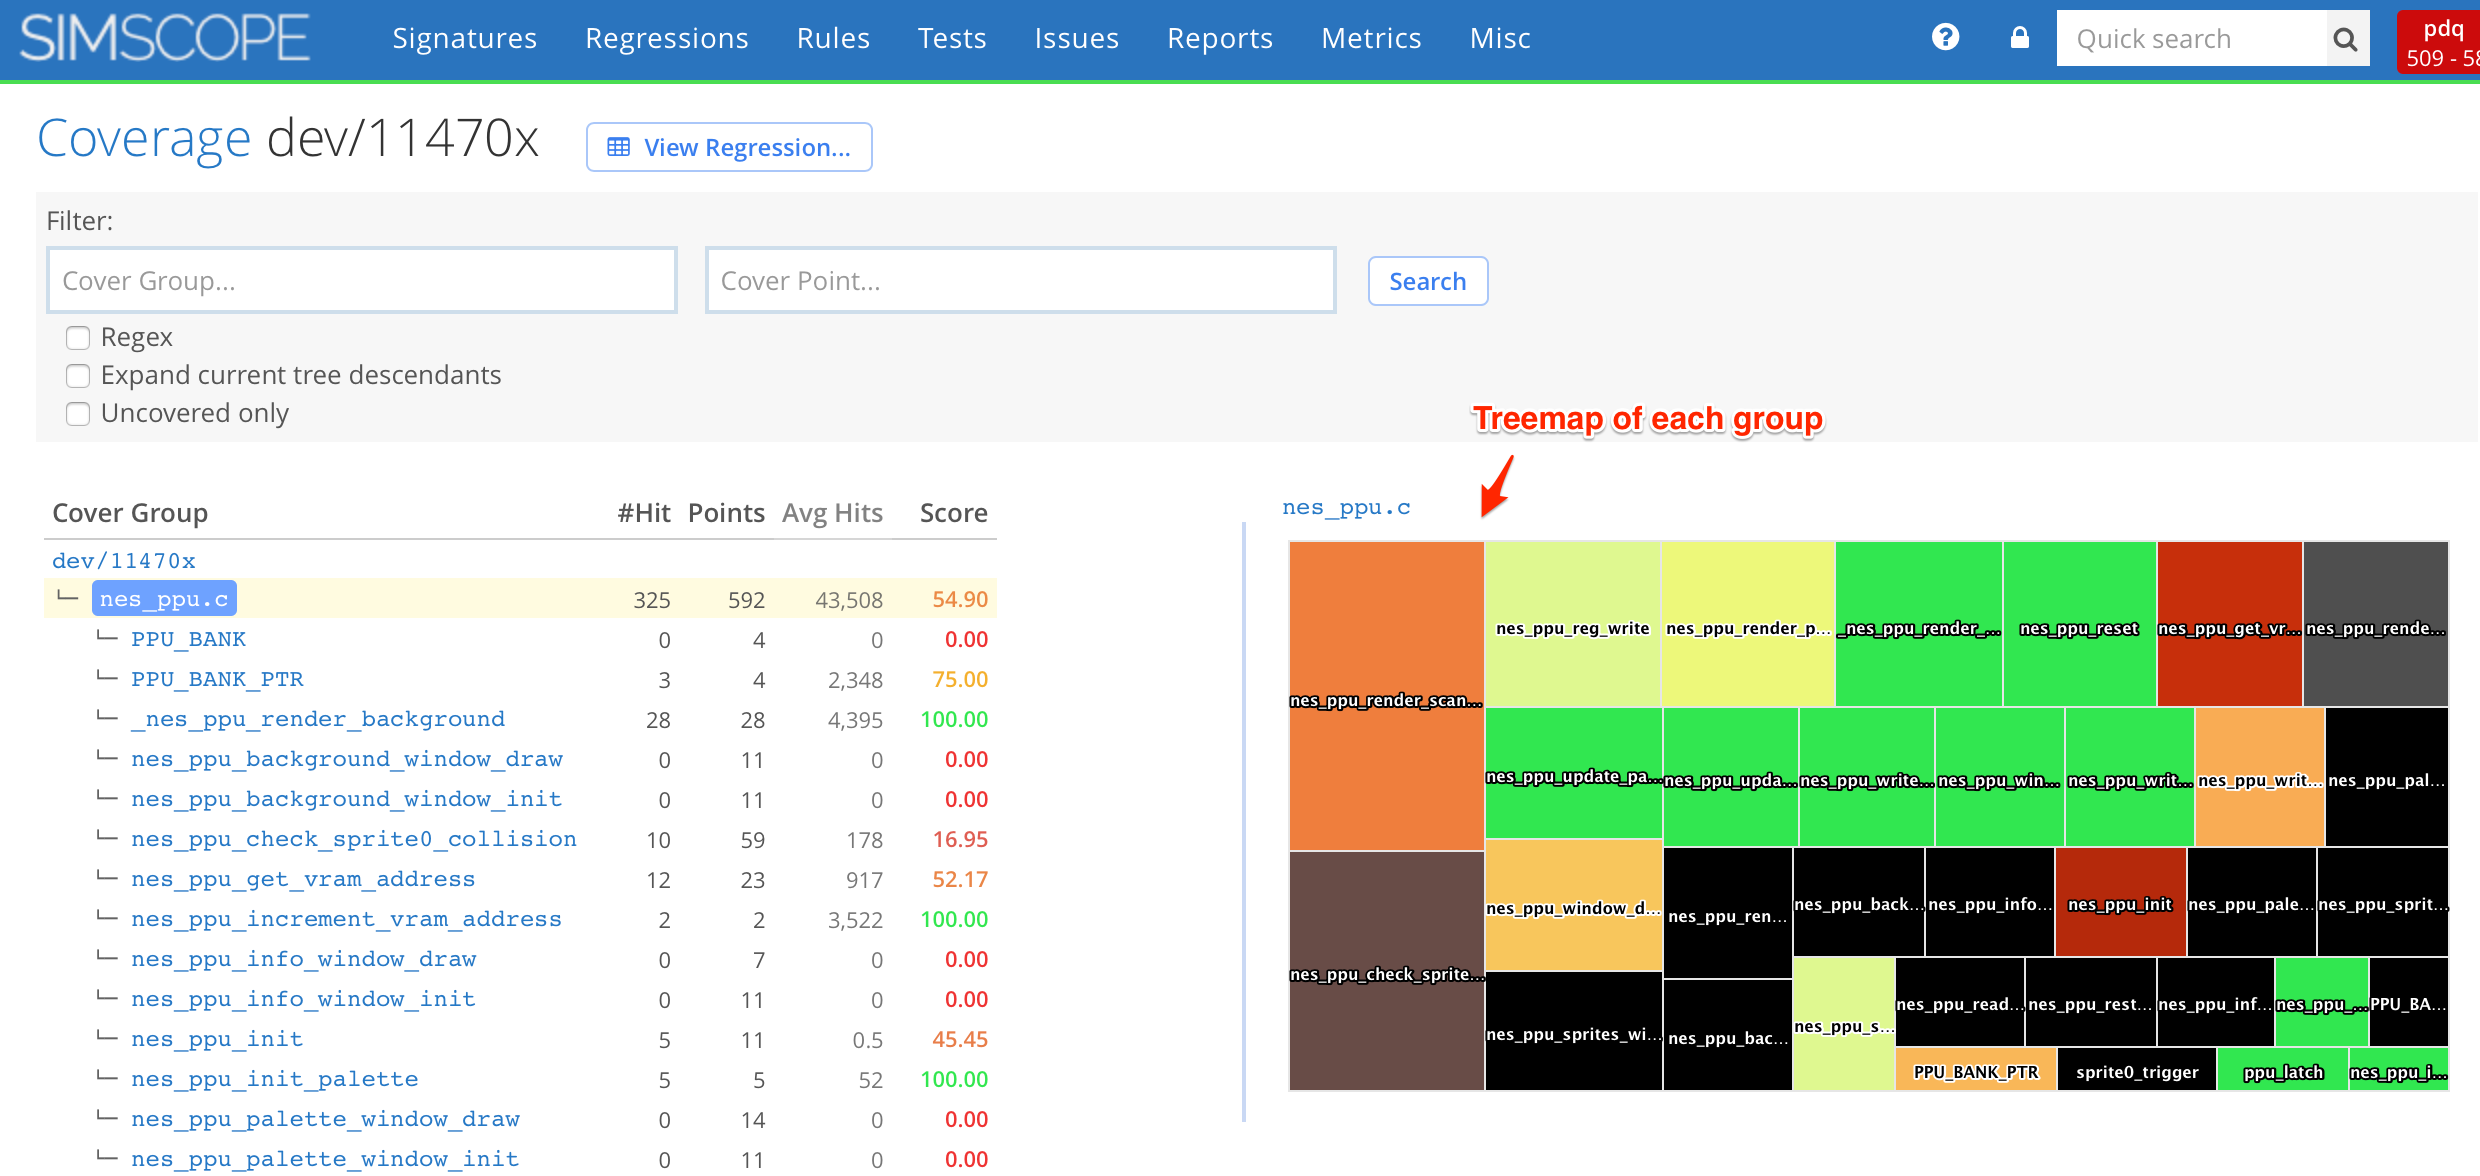
Covergroup Heatmap
Simscope renders a heatmap of the current coverage groups:
- The overall group score is represented by the node's color (ie green for 100%)
- The total number of coverage points in the group are represented as the node's area (larger nodes have more coverage points)
If you click on a group, Simscope will drill into the details of that group.
Exclusion Rules
Coverage Exclusion Rules let users exclude coverage points from coverage calculations, which improves coverage hit percentage (since coverage points matching rules are omitted).
Exclusion Rules are currently stored in user's browser cookies.
- In future versions, these will be stored on the server database.
They can be either plain text or regular expressions. Example exclusions:
assert→ plain text, matching any coverpoint containingasserttop.*core1→ regular expressiona.b.c.bar→ regex (because the pattern contains the.character)
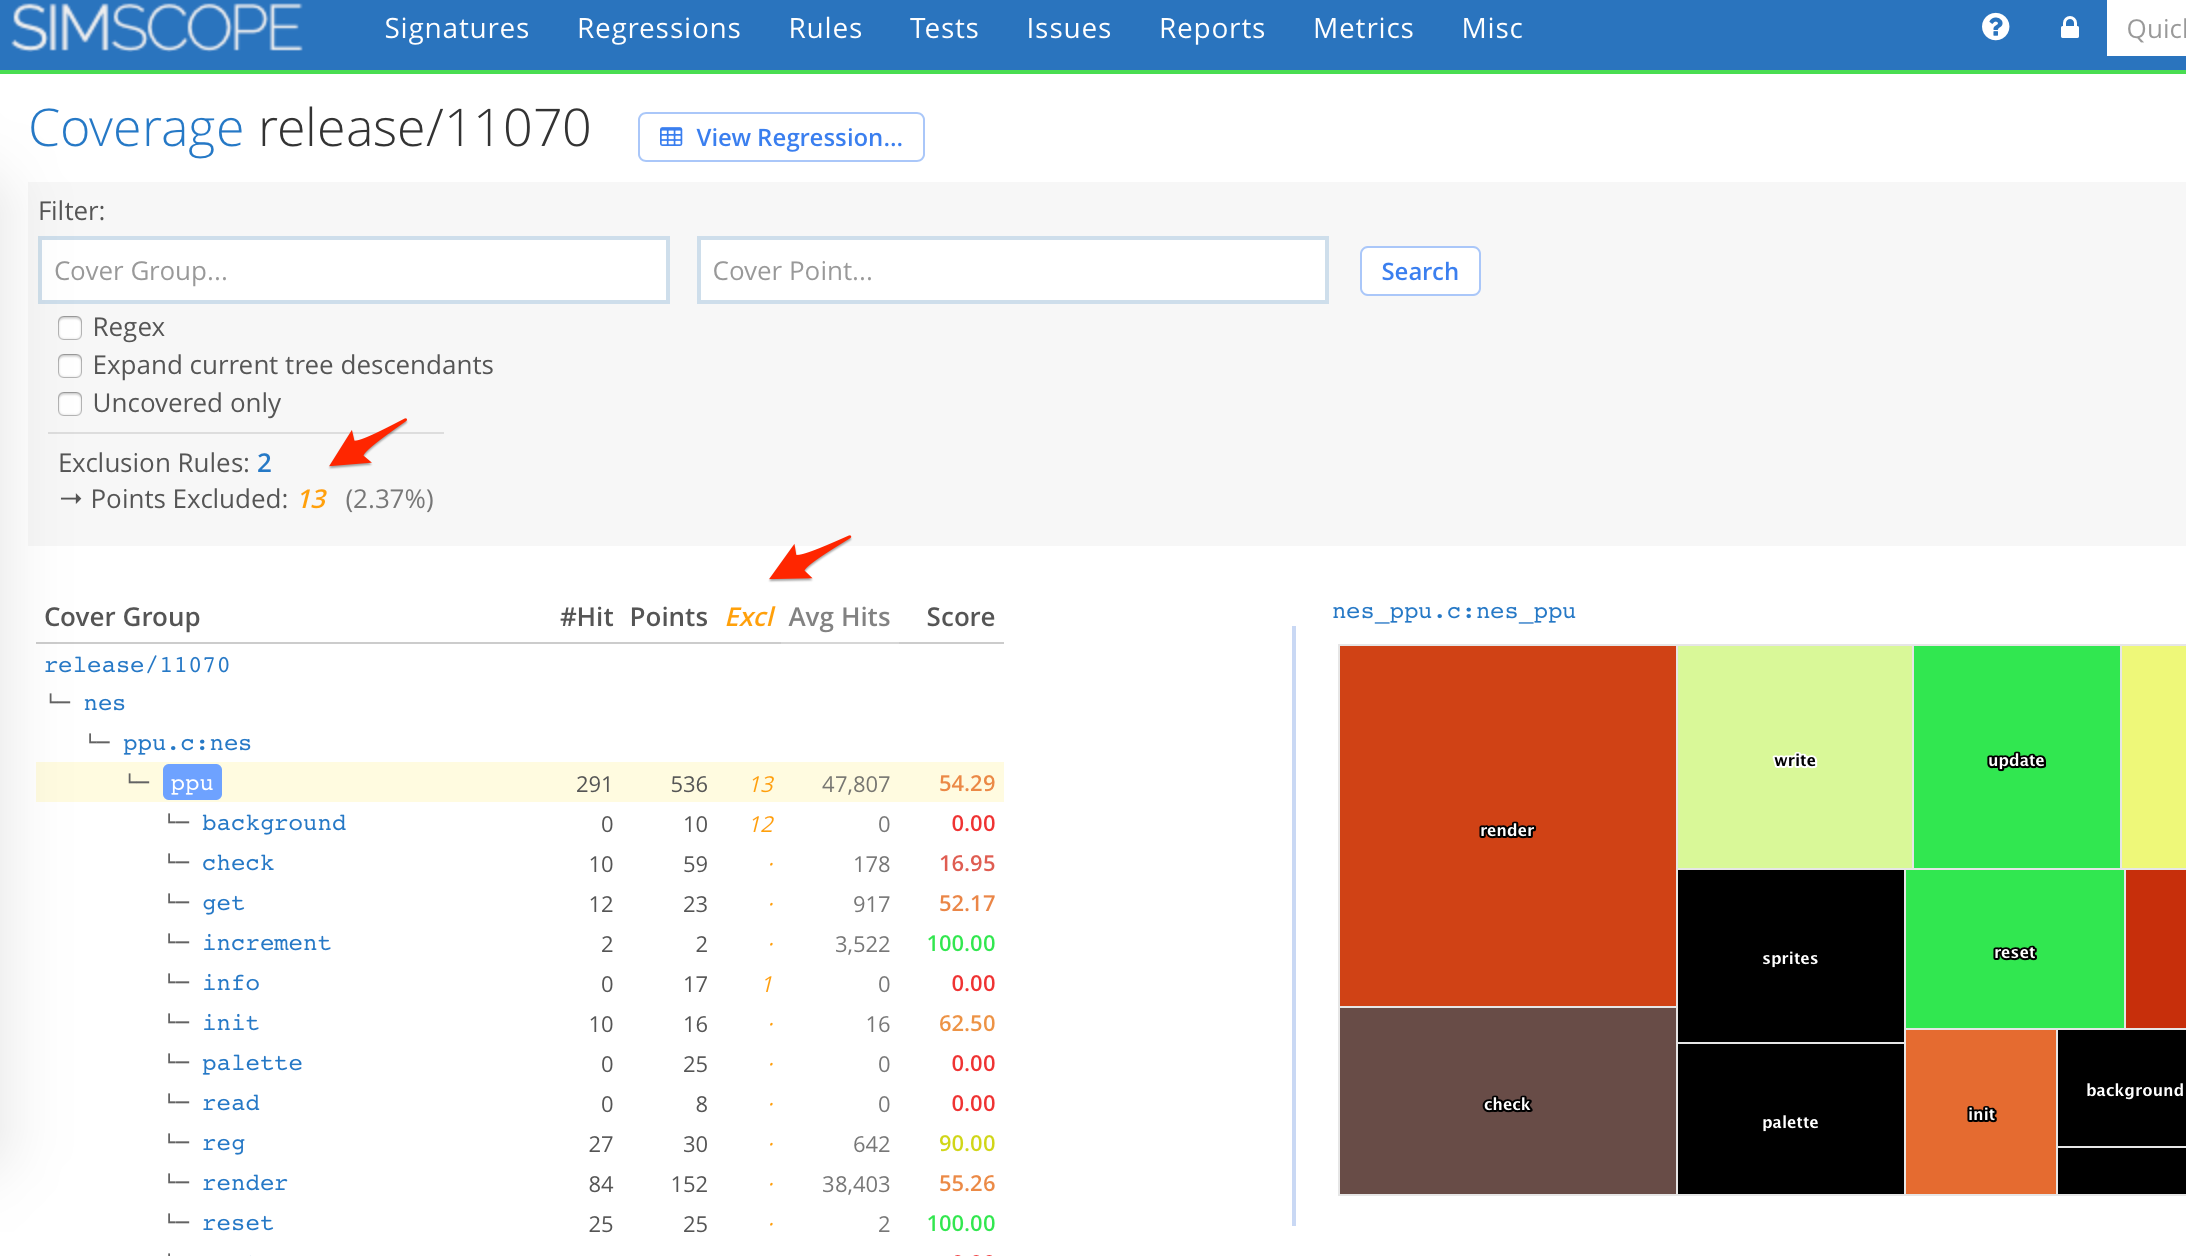
Example Exclusion Screenshot
This screenshot shows 2 coverage rules, which excluded 13 coverage points from calculation.
You can also see an Excl column in the table, which shows how many coverage points are
excluded across each group.
Charts
→ See Coverage Search for more on coverage searching and charting.
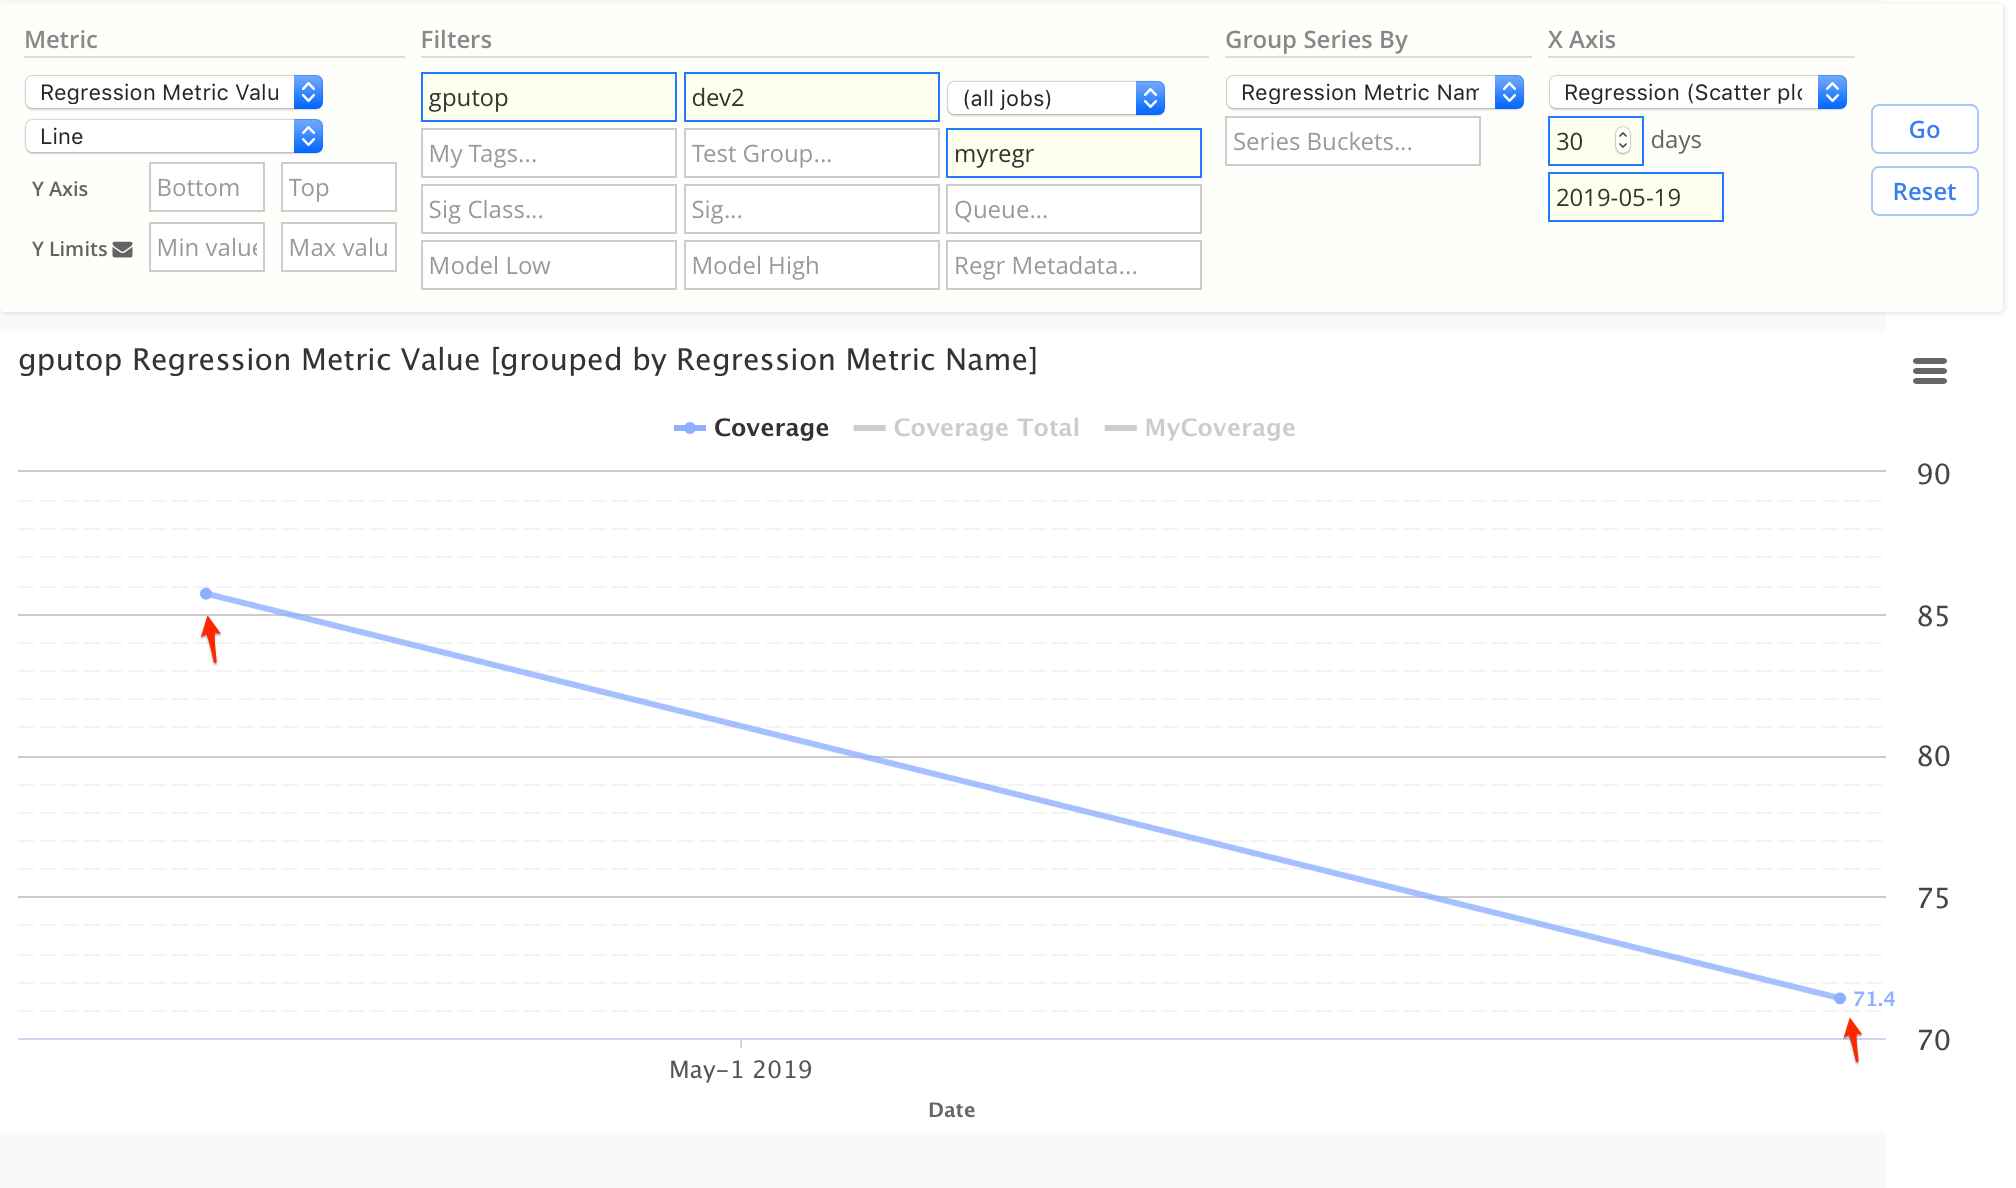
Coverage DB values can be charted (both the total number of coverage points and the total percentage hit).
- You can also set up notifications to get automatic email results if coverage drops below a threshold limit.
This example shows total Coverage on a line chart (note 2 gputop regressions matching).
Other uses of Coverage DB
This feature may be used for Test plans, Lint/CDC (Spyglass).
- Please contact VerOps for more info.