Simscope Release History — v280 — 289
1.289
1. Regression submitted field (# of jobs launched)
submitted — this is a new optional Regression JSON metadata
field, which enables Simscope to track the number of expected jobs in a regression.
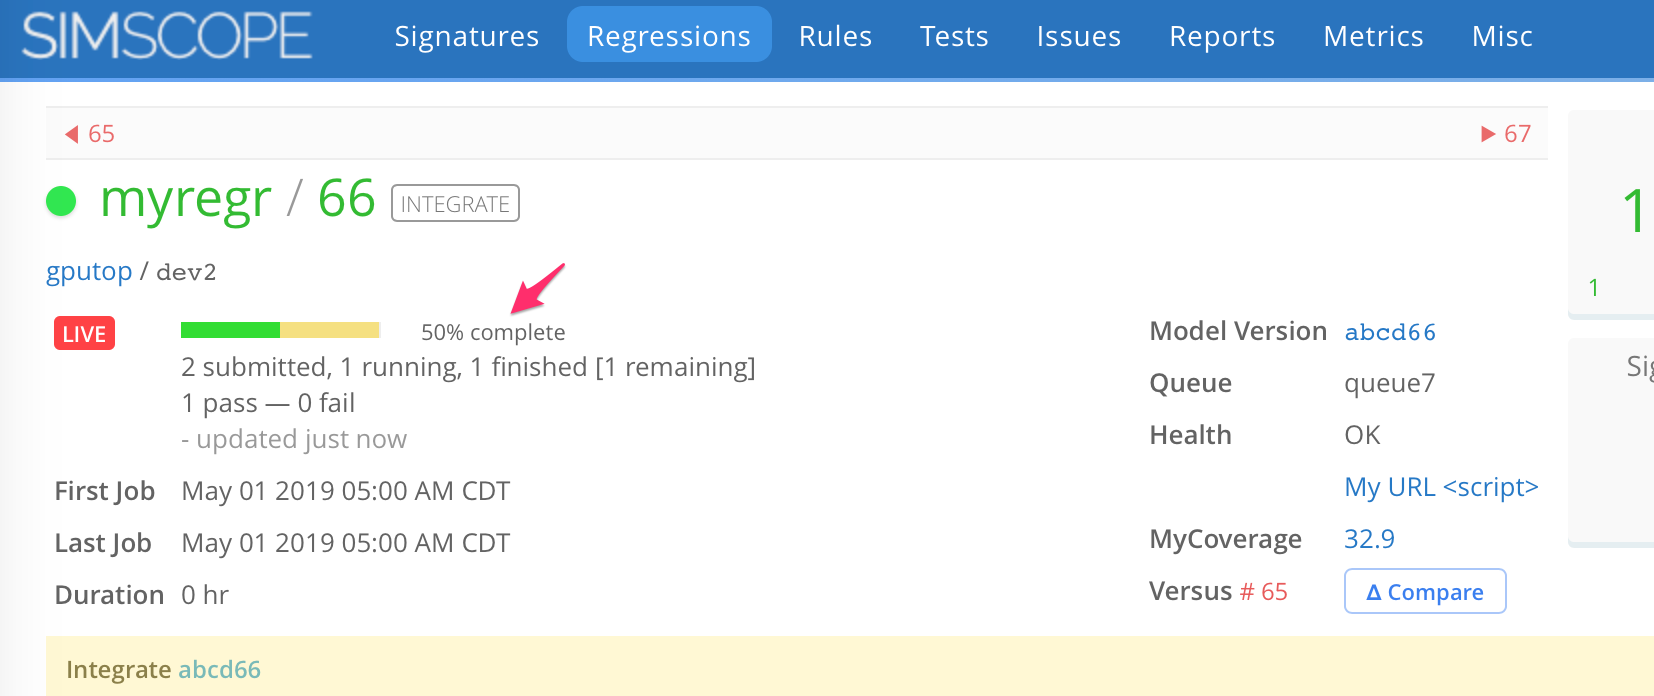
If this field is set to an integer greater than zero, Simscope will automatically show a progress bar, while the regression is running and as job results are received.
Here is an example regression at 50% completion progress (based on submitted=2):
Aborted regressions
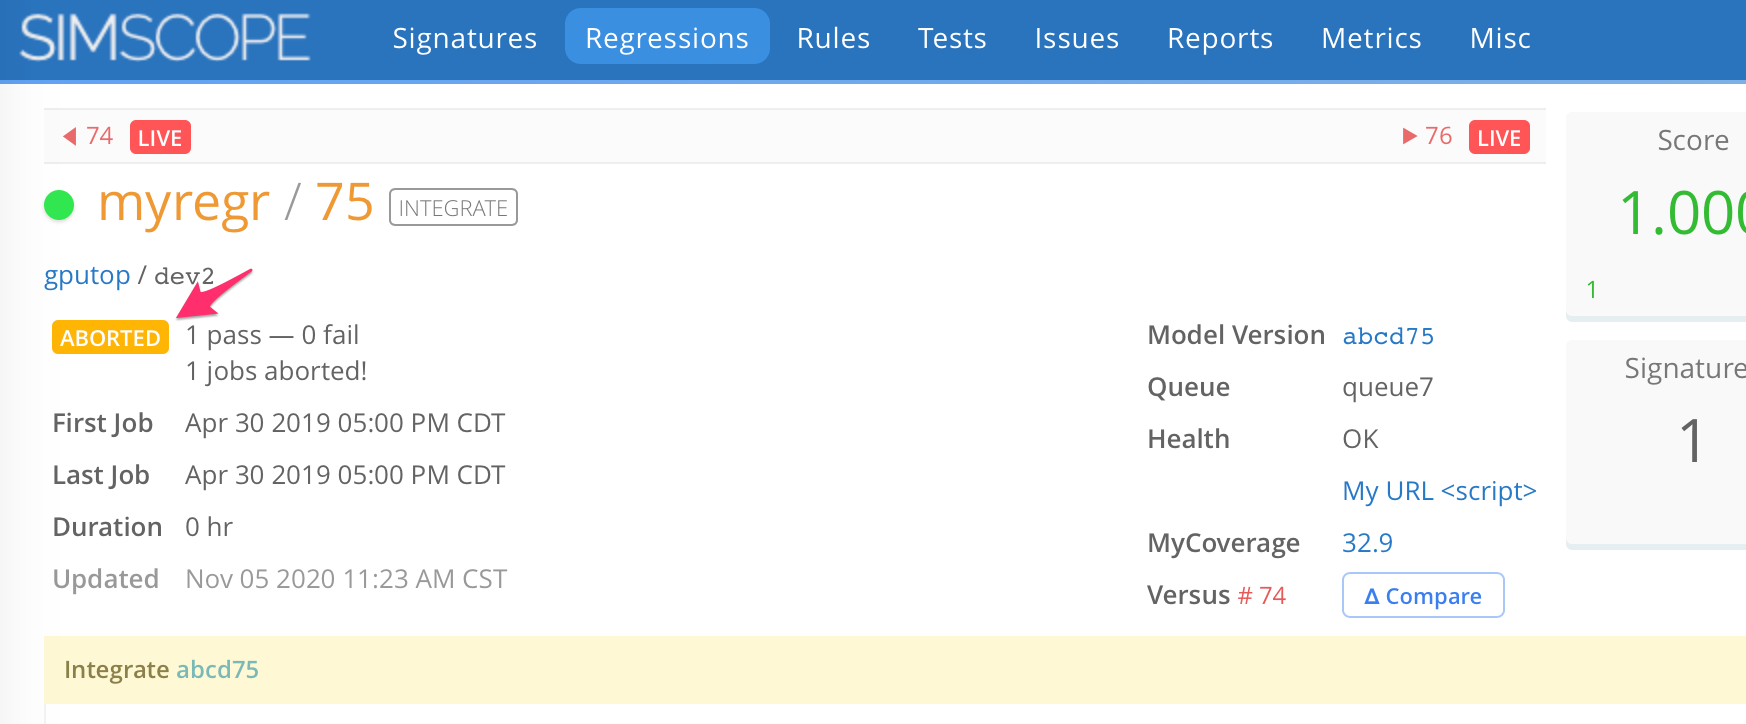
If the regression finishes before submitted is reached, Simscope will mark the regression
as ABORTED, to indicate either the regression was killed manually or that for some reason
not enough jobs were received.
Here is an example aborted regression (where submitted=2 and finished with only 1 job
received by Simscope):
Sample JSON
In this JSON example, submitted is set to 200, and Simscope will show a progress bar
while the regression is running.
{
    "name": "cpu_smoke/12.4",
    "component": "cpu_core",
    "project": "CPU",
    "model_branch": "master",
    "model_version": "2500",
    "model_timestamp": "2020-02-03T12:00:54Z",
    "starttime": "2020-02-05T22:00:53.842443Z",
    "userid": "admin",
    "host": "c-2",
    "command": "flow --regr --seed 6801a9 MODEL=1a4",
    "dir": "/mnt/proj/regr/smoke/12.4",
    "submitted": 200
}
1.288
1. Metrics "Bar Running Total" chart
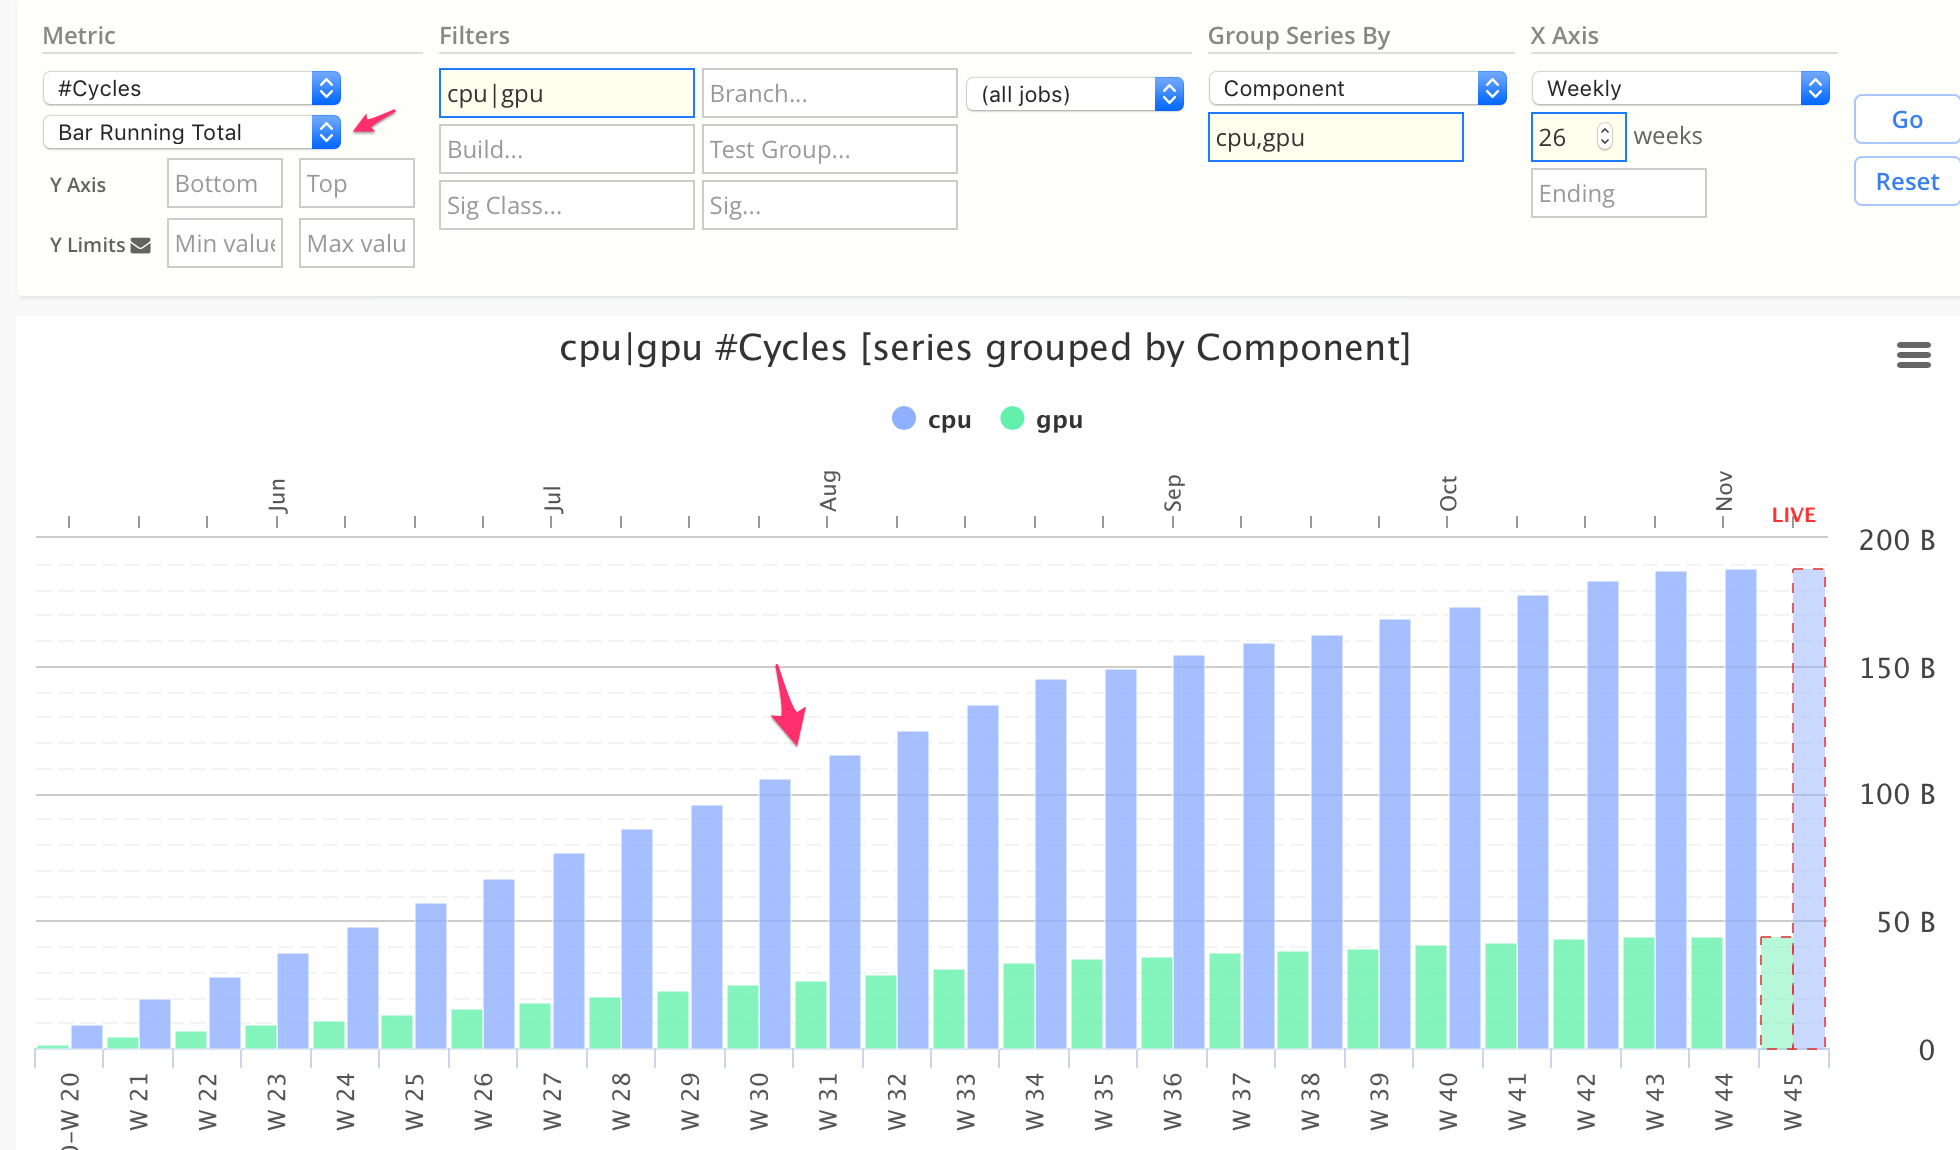
The "Bar Running Total" chart now displays as separate columns, rather than stacked columns.
If you want a running-total stacked column view, use the "Area Running Total" chart instead.
1.287
1. Client browser timezone support (HTML)
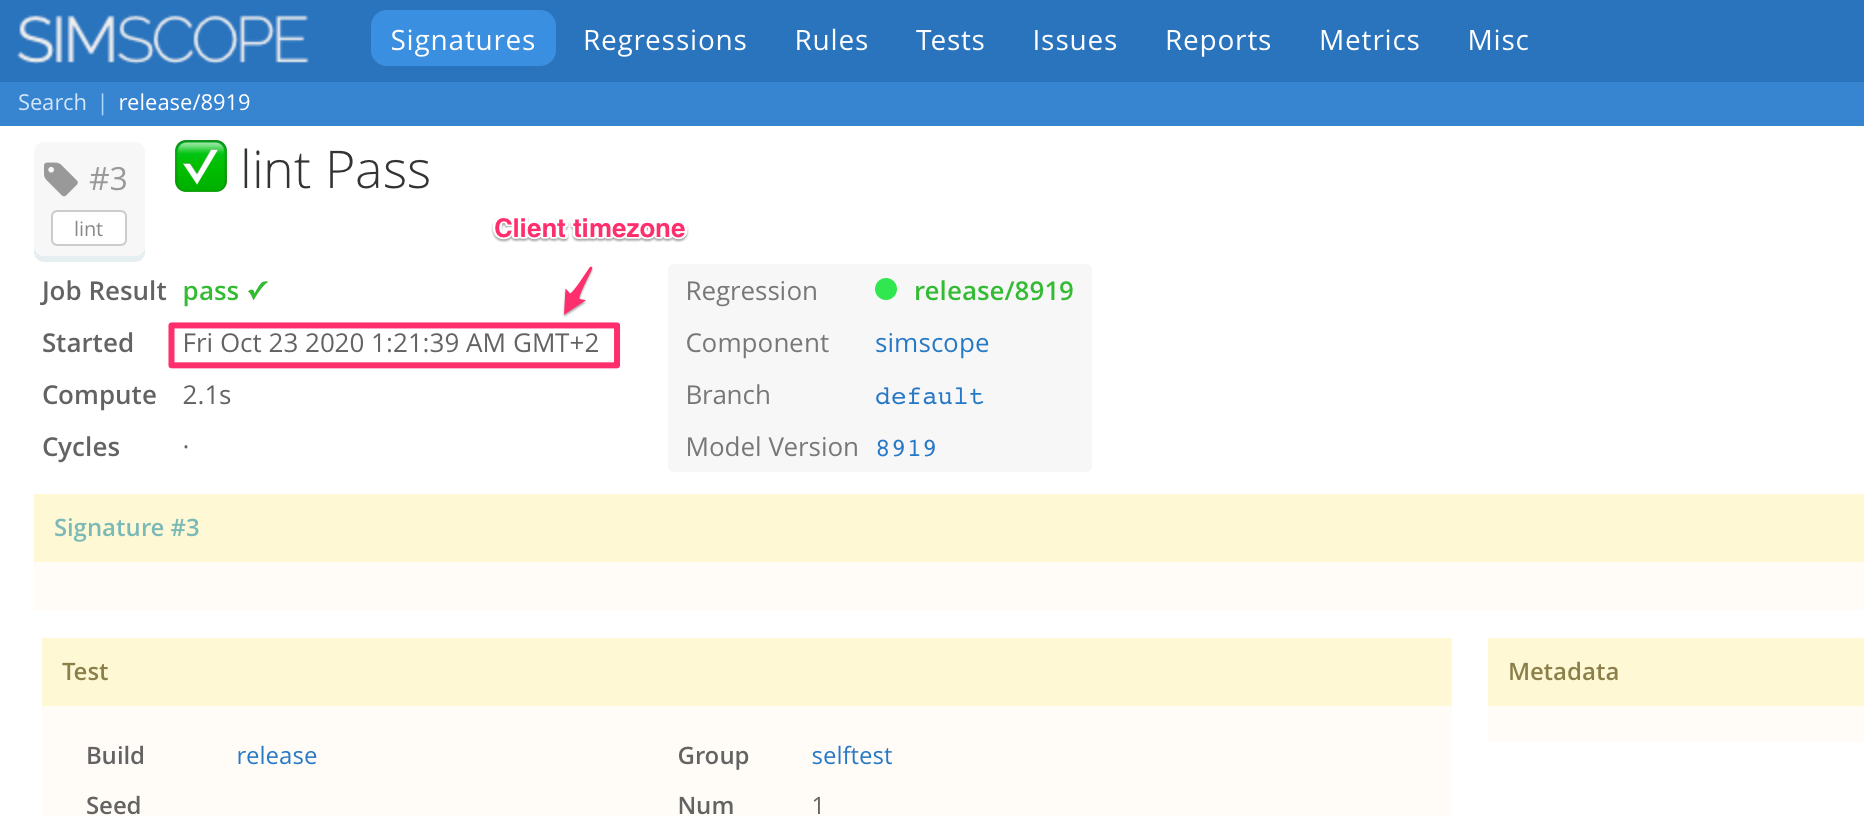
Simscope will now show job timestamps using the client browser's timezone.
For example, if the server is in US/Central, but the client browser is in
Europe/Amsterdam, jobs will show up in the browser using the Amsterdam timezone:
NOTE: jobs are still stored internally using the server timestamp, and regression/signature searches still are still based on server (not client) timestamp.
2. Metrics group-by-user
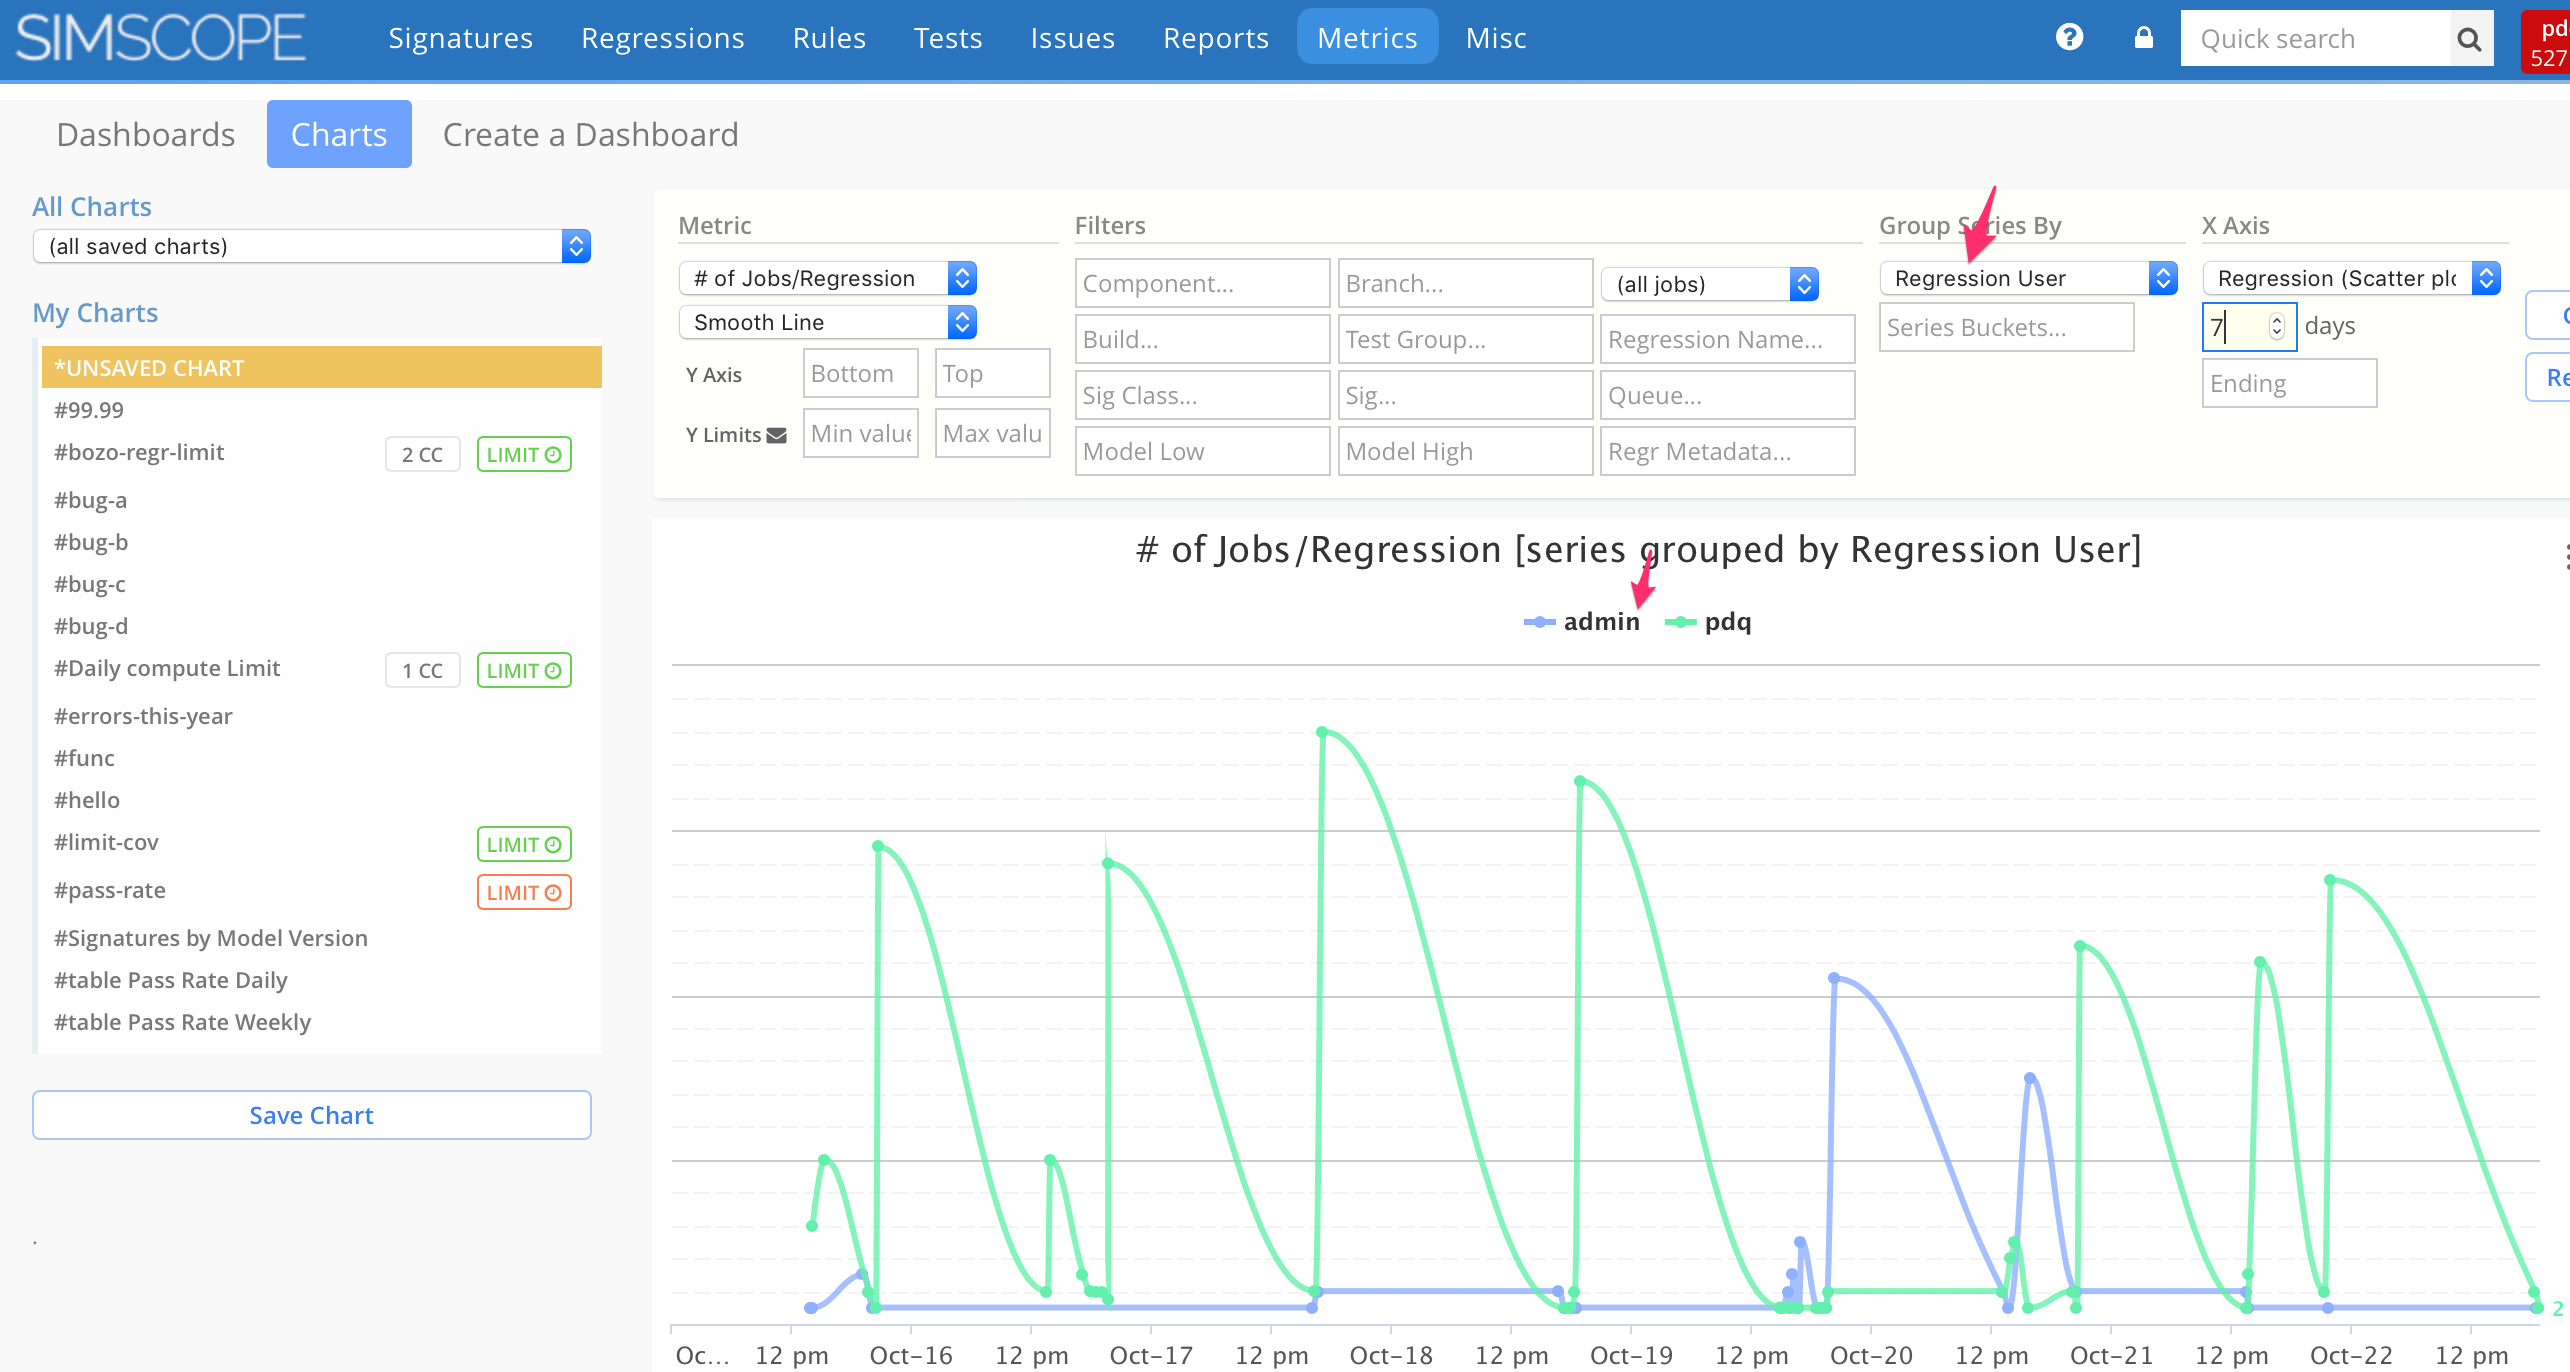
Metric charts can now be grouped by the user who launched the regression.
For example, this chart shows number of jobs per regression, grouped by user:
3. Job details plugin for pass jobs
The Job details plugin can now be optionally executed on both pass and failing jobs.
To enable for passing jobs, add the following to simscope.config:
[sigs]
# Enable job details plugin on both passing and failing jobs (vs fail jobs only)
jobdetailspluginpass = true
1.286
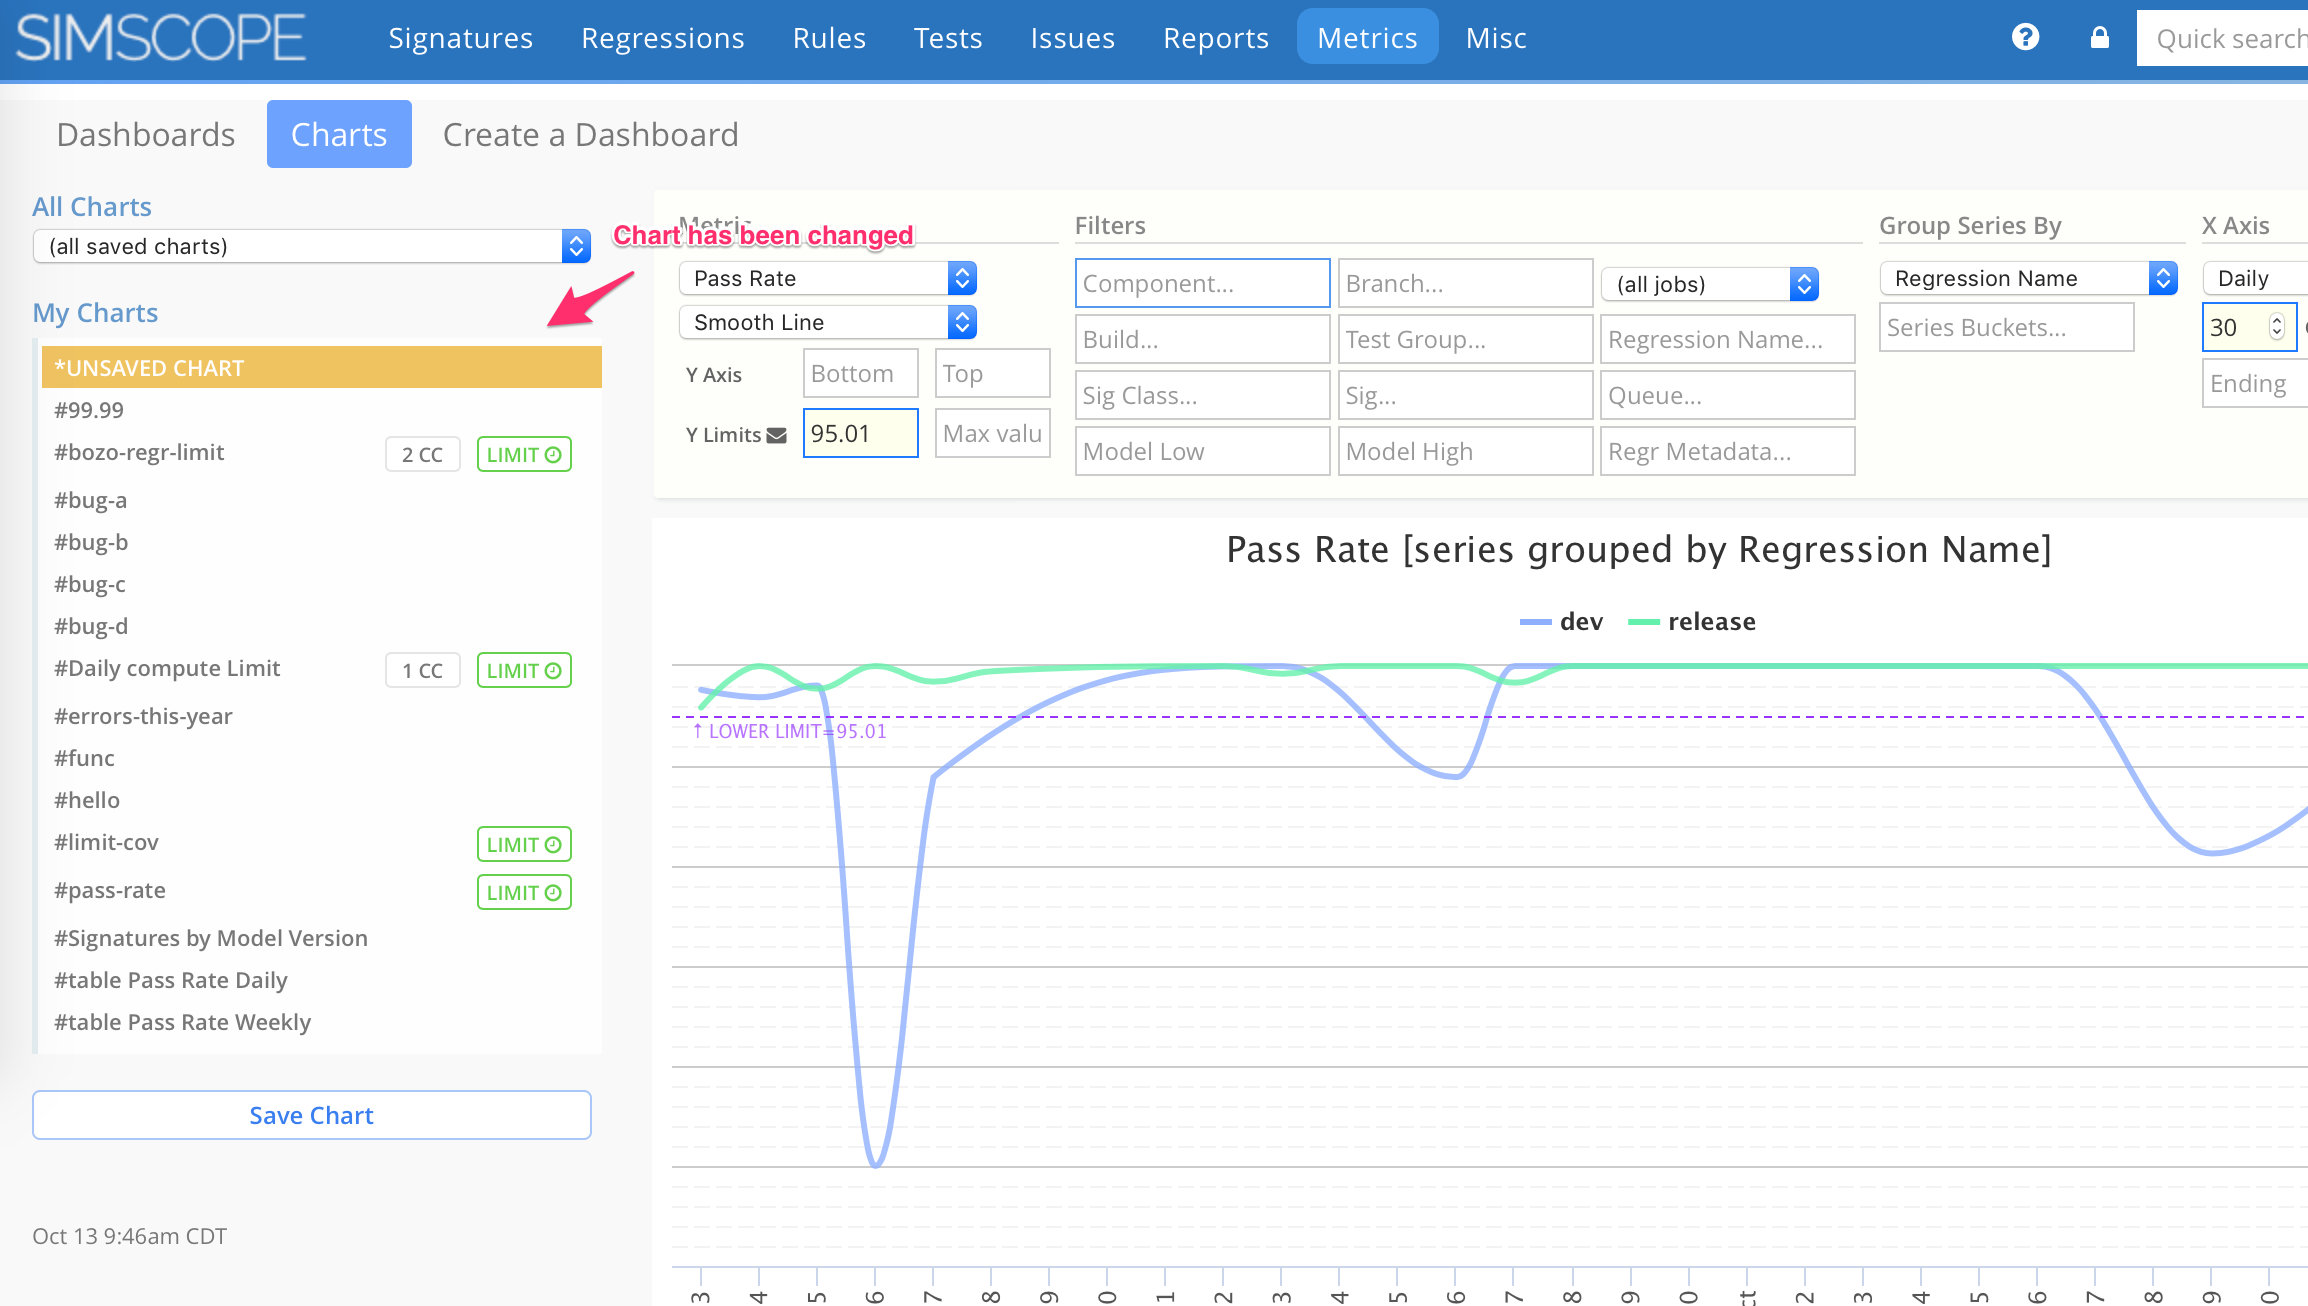
If a user modifies any chart configuration, Simscope now show a CHART UNSAVED indicator, to remind the user to save the chart.
1.285
Improved job alias debugging.
1.284
- feature → Instant Regression fail email notification
- feature → Home page Dashboard date selector
- bugfix → Metric limit fail email CC fixed
1. Instant Regression fail email notification
Simscope can now send a notification email to users immediately once a regression has failed (rather than getting a daily email).
Notes:
- If the regression fails, a notification email is sent immediately.
- If the regression passes, no email is sent.
- Note: this is an alternative notification to the "daily" regression email, in case you want an instant email notification, rather than a daily summary.
2. Home page Dashboard date selector
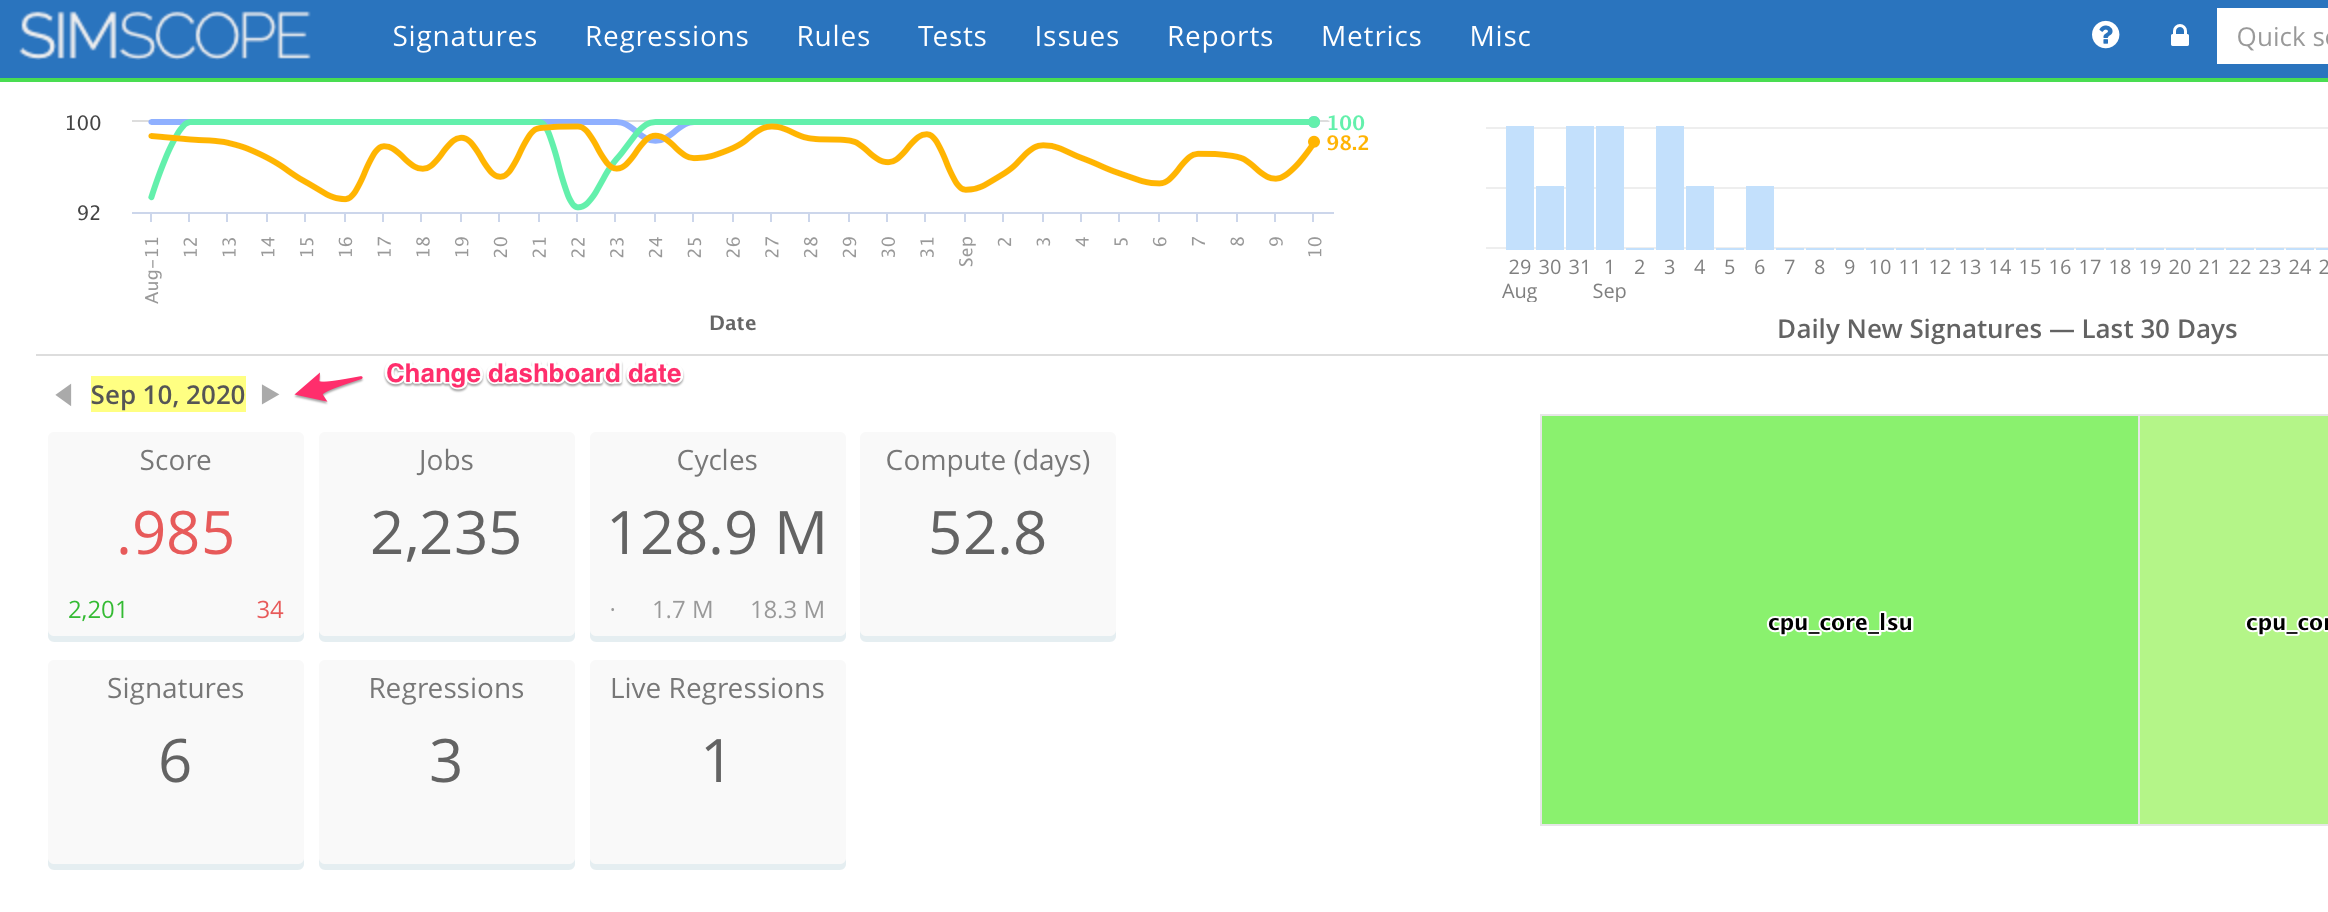
The Simscope home page Dashboard can now switch dates. This lets you see statistics for any date selected, rather than just showing today's statistics.
- Click the left or right arrow to change Dashboard dates.
1.283
- feature → Numbers under 10,000 now use commas
- bugfix → Chart limit 100% rounding fixed
- bugfix → Test List search missing regression-exclude
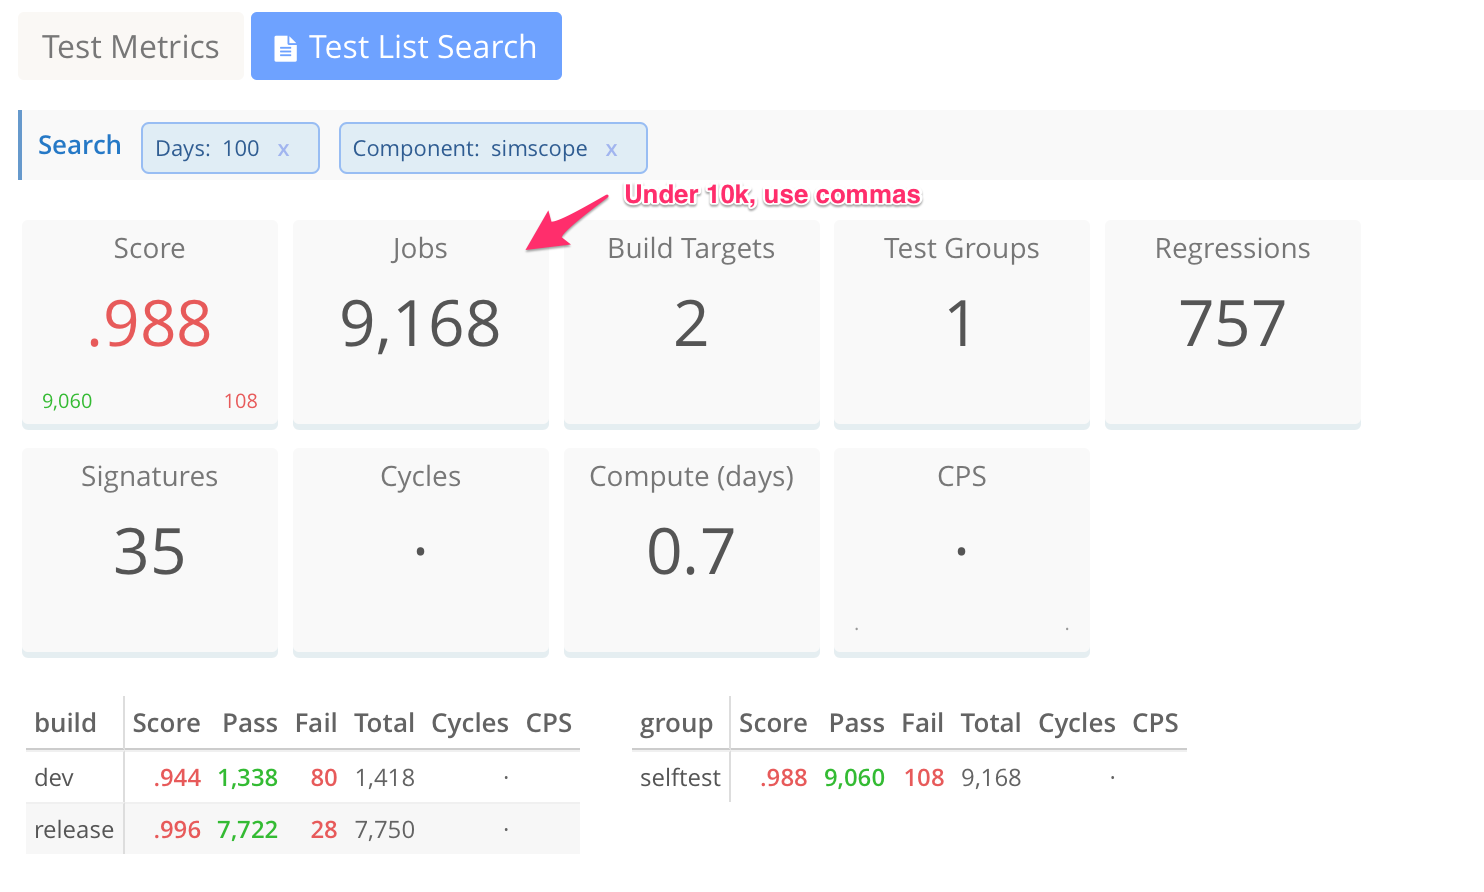
1. Numbers under 10,000 now use commas
In previous Simscope versions, the value 1,234 would be displayed as 1.2 K.
Now numbers up to 9,999 are represented with comma separators.
Numbers above 10,000 are displayed with K/M/B/T suffix (thousand, million, billion, trillion).
Example:
2. Chart limit 100% rounding fixed
In previous versions, a pass rate value of 99.99% would be rounded to 100%. This bug is now fixed to show 99.99%.
3. Test List search missing regression-exclude
Test List search now can filter out regressions containing a pattern.
1.282
- feature → Filter Regression signatures by
Classification - bugfix → Simscope now allows external URL proxying
- bugfix → Charts can now fail
limitsacross multiple series.
1. Filter Regression signatures by Classification
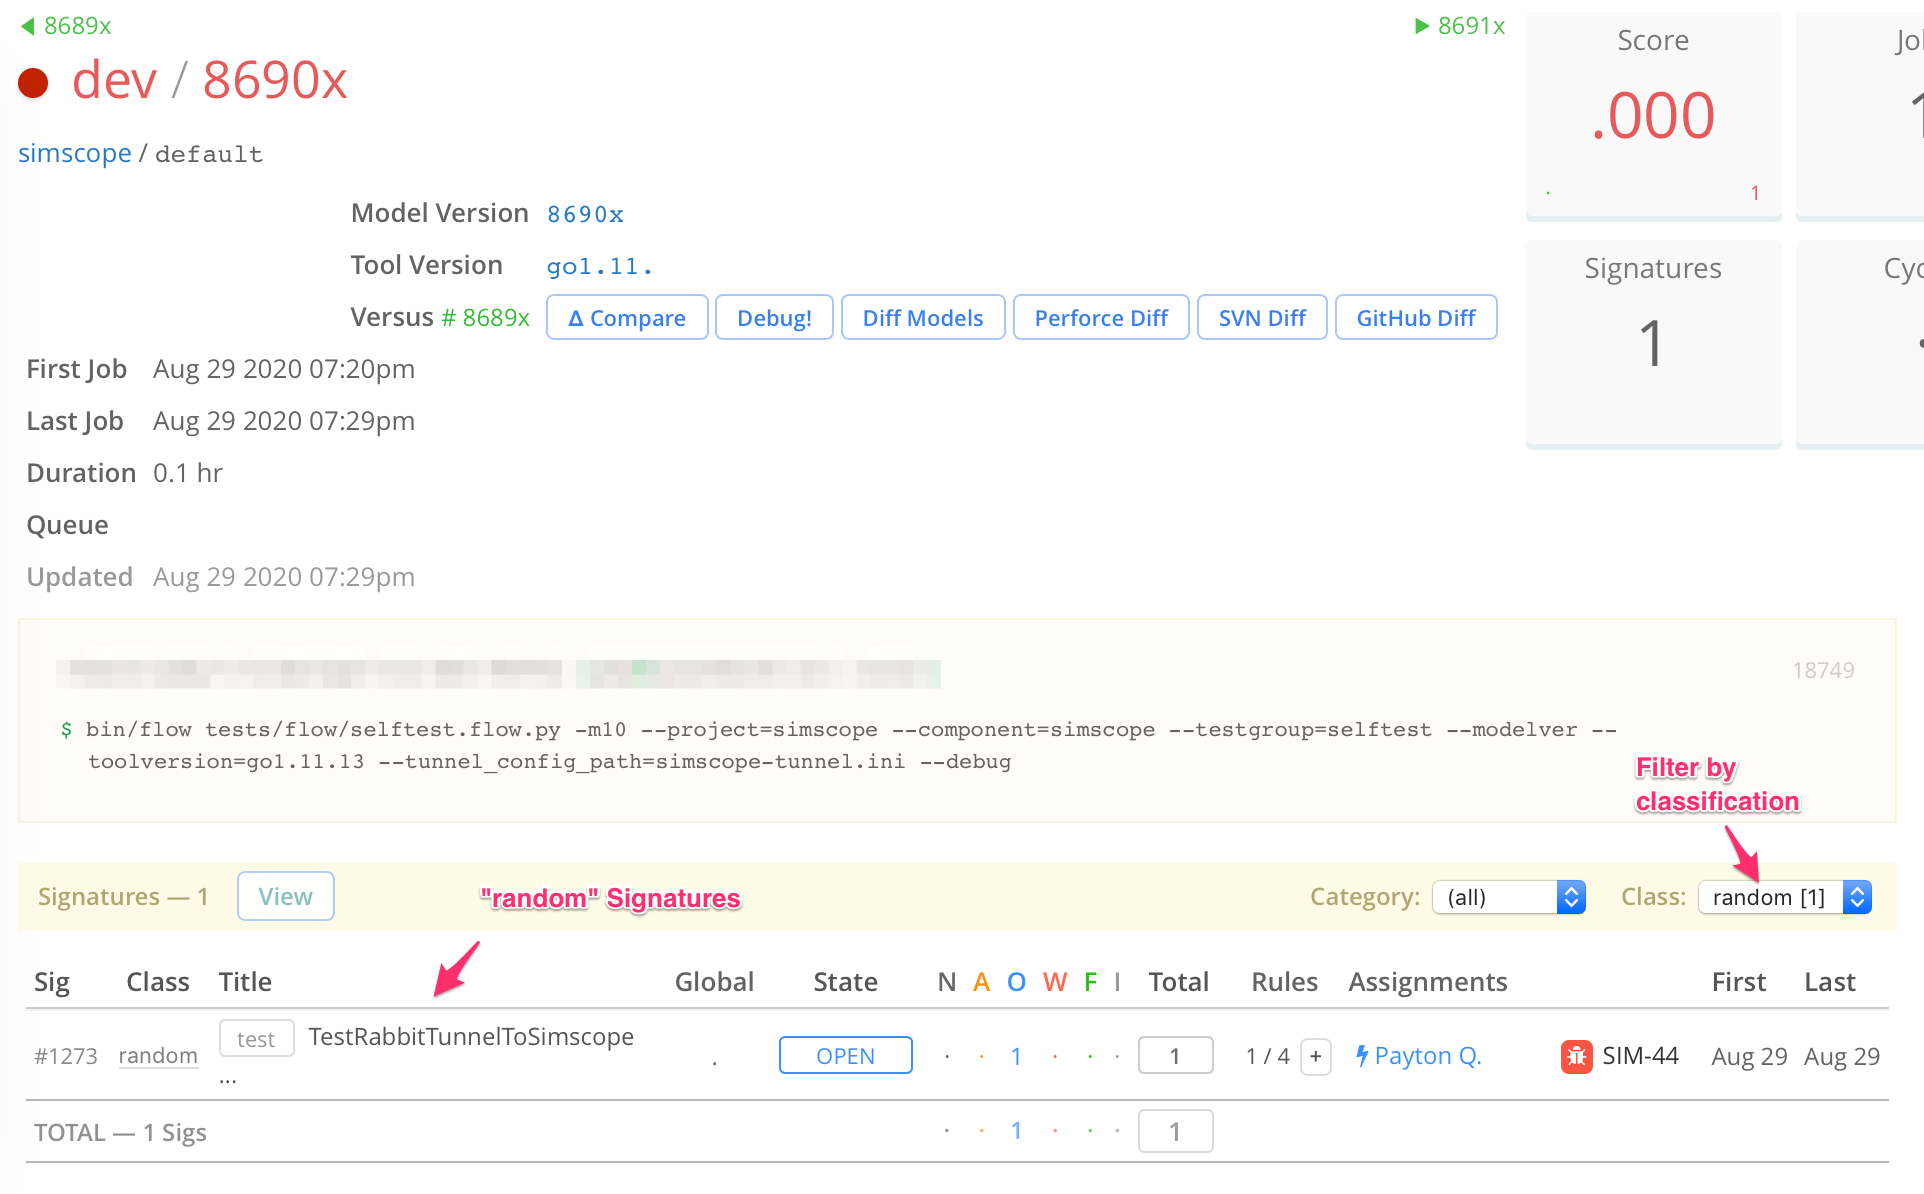
Simscope can now filter signatures within a regression, if they have been classified. Click the dropdown, and it shows all classifications for the current regression.
This example shows filtering a regression by only random errors.
2. Simscope now allows external proxy URLs
If Simscope's HTTP/HTTPS traffic is proxied externally (ie not on a local :8080 port),
Simscope can now display web links properly (for example within a URL).
Note: to use Simscope behind an http proxy, you need an external proxy software configured and running. Contact VerOps for more info on how to do this.
This is configured within the simscope.config file, using the httpaddr and serverurl
variables:
| Field | Purpose | Example |
|---|---|---|
httpaddr | Local address to run the Simscope server on. | :8080 |
serverurl | External (or proxy) address, to render links. | http://myservername |
Example configurations
Here are some configuration choices. The most common is #1.
# 1. Standard configuration (most common), using the same port internally and externally.
# This example will serve to users at [http://myserver.company.com:8080]
[server]
httpaddr = ":8080"
serverurl = "http://myserver.company.com"

# 2. IP-based configuration, using the same port internally and externally, and with
# a fixed IP addresses.
# This example will serve to users at [http://IP.ADDRESS:8080]
[server]
httpaddr = ":8080"
serverurl = "http://IP.ADDRESS"

# 3. Proxy configuration, using https (secure http), with a different local port.
# This runs simscope internally on :8080,
# but proxies externally via https on port 443 at [https://simscope.company.com:443]
[server]
httpaddr = ":8080"
serverurl = "https://simscope.company.com:443"

# 4. Proxy configuration, using http, with a different local port.
# This runs simscope internally on :8081 (note this can be any port),
# but proxies externally via http on port 80 at [https://simscope.company.com:80]
# CAUTION: proxying http traffic externally (outside of your LAN) is not secure.
[server]
httpaddr = ":8081"
serverurl = "http://simscope.company.com:80"
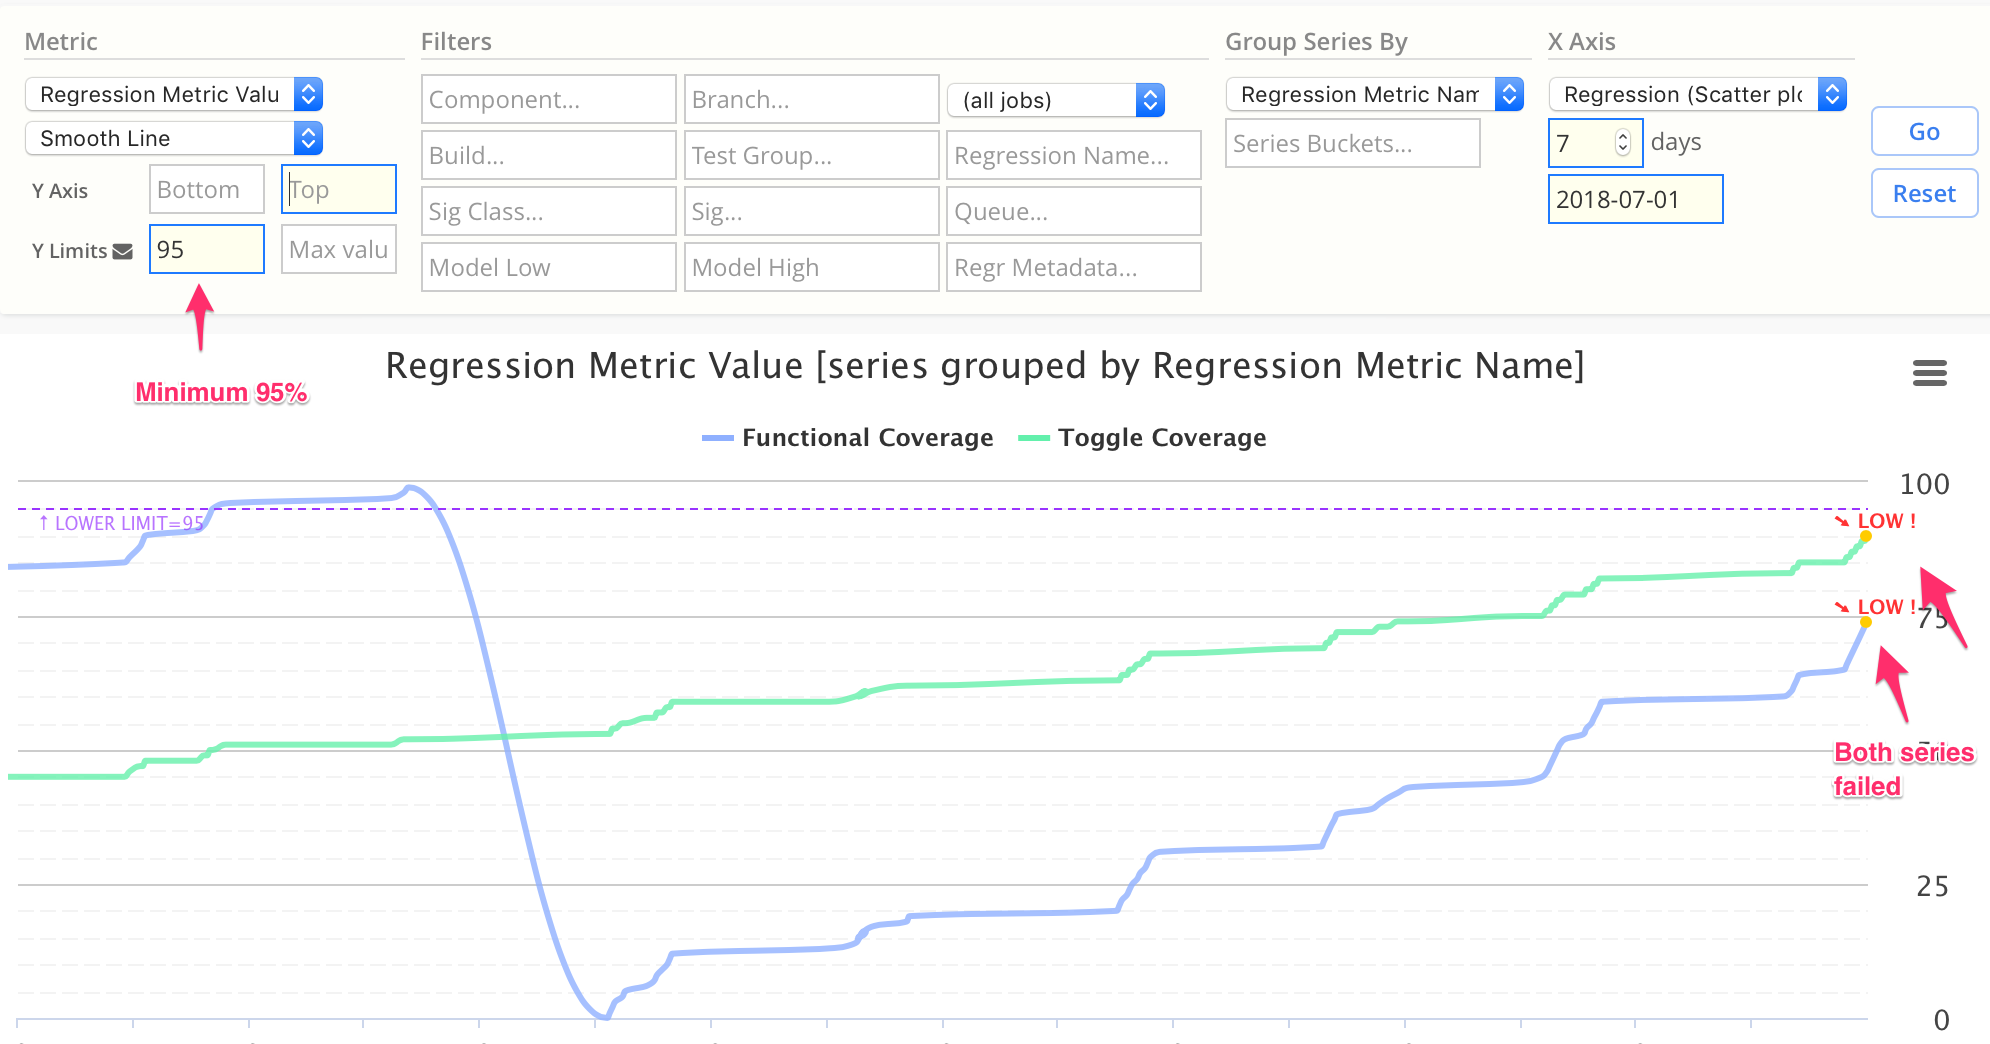
3. Charts now show multiple limit failures
This example shows a chart failing in both series, due to not meeting 95% coverage.
1.281
- feature →
Chart Limitemail CC's - feature → Signature table can now be sorted by
Classification
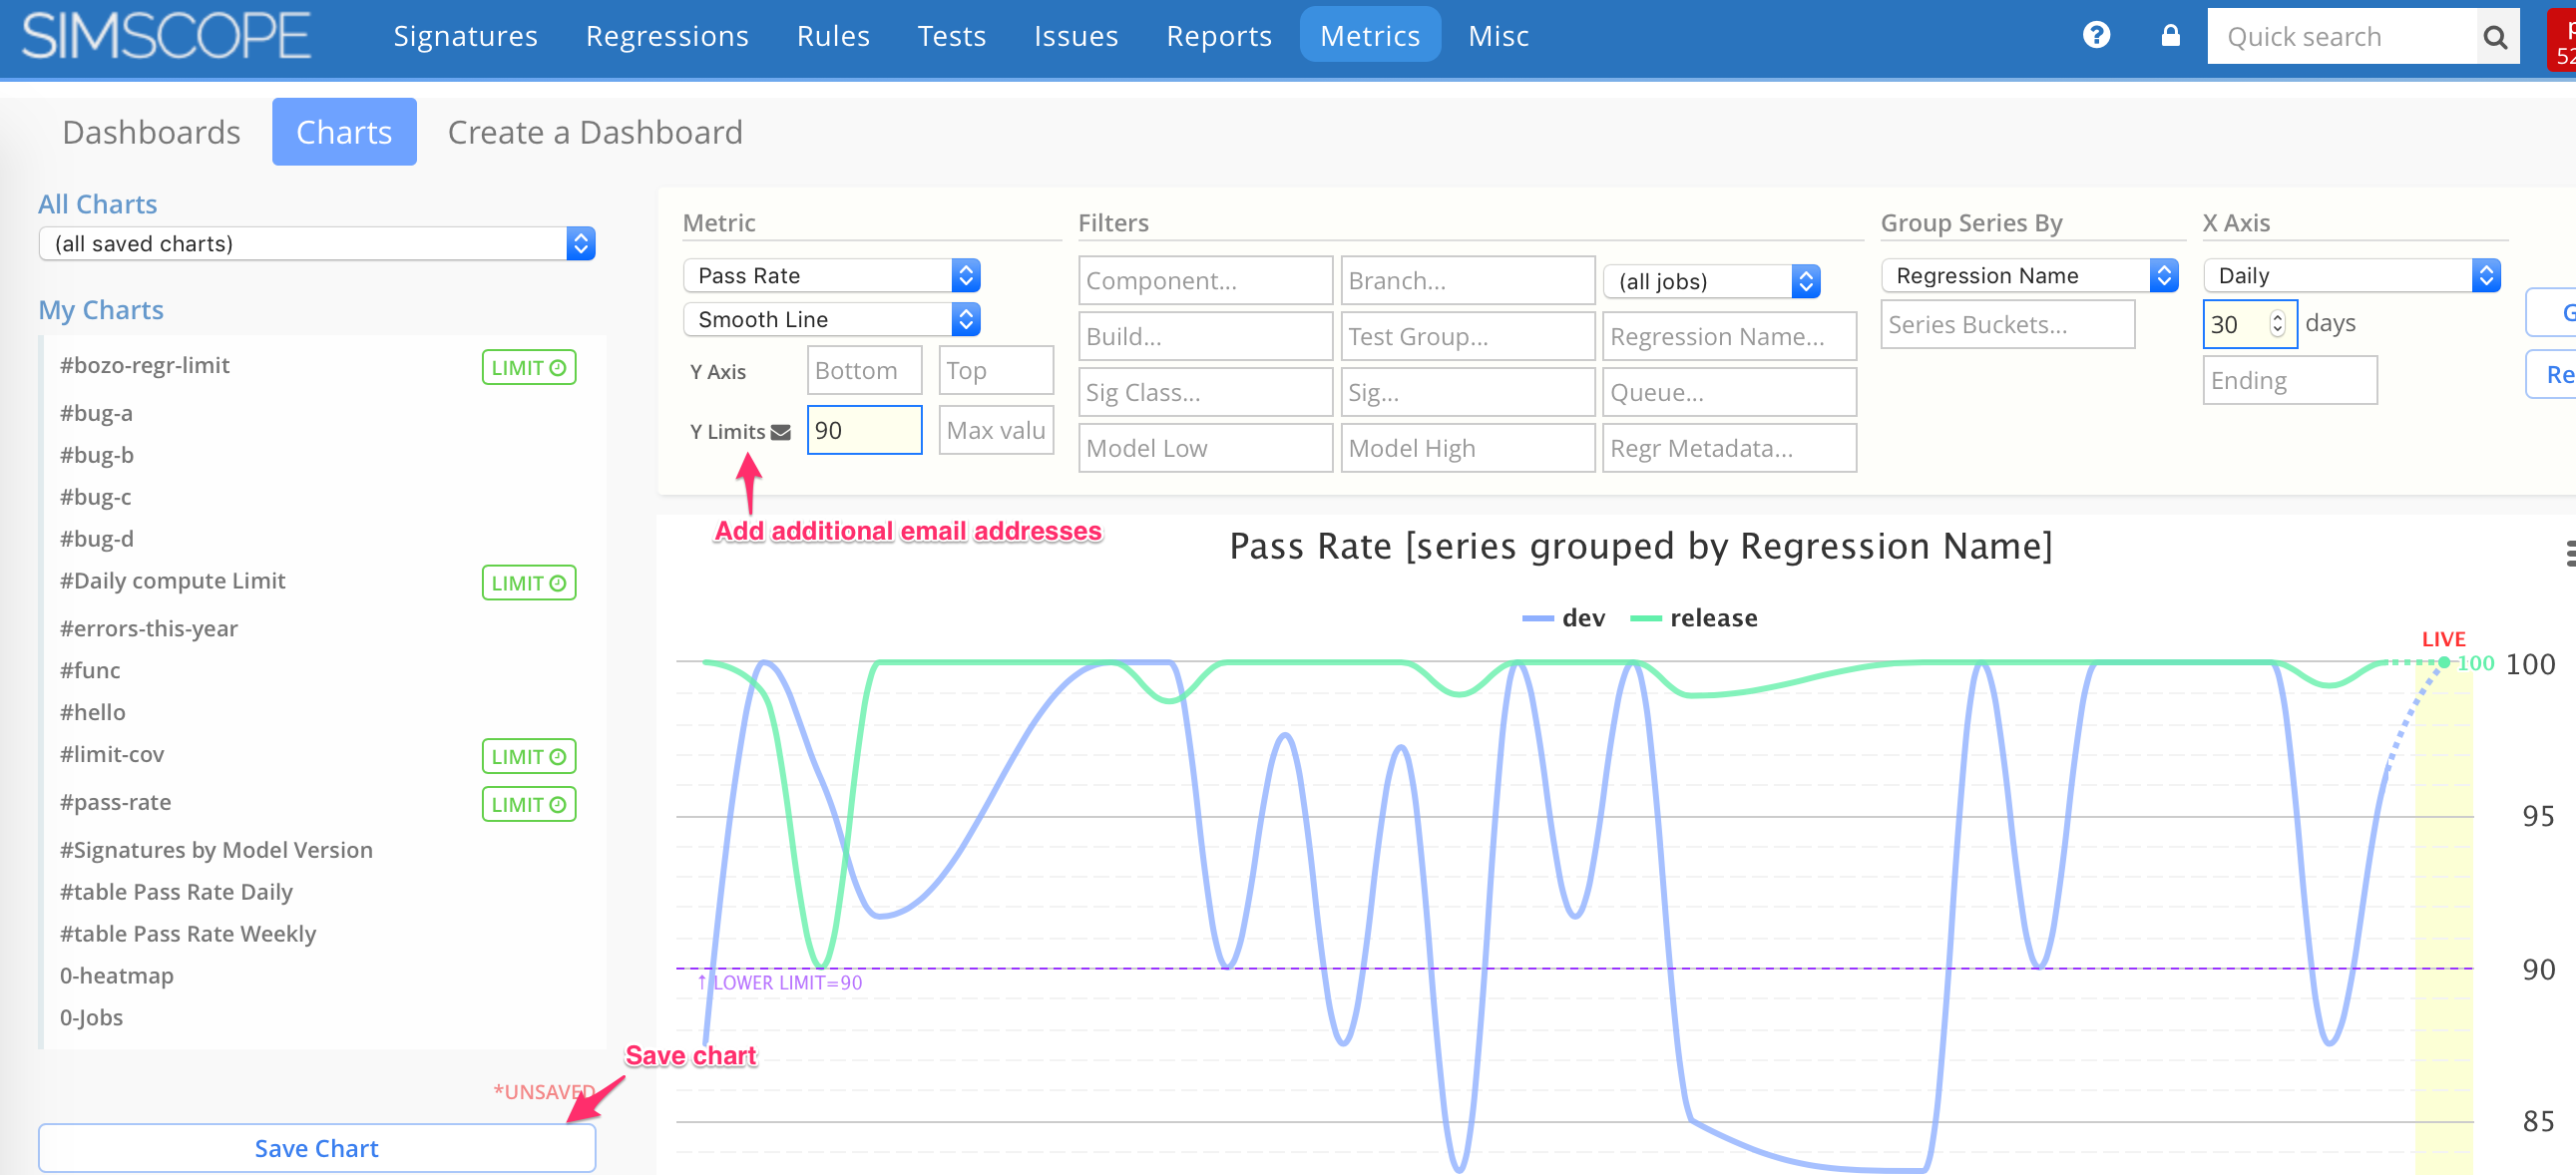
1. Chart Limit email CC's
If a metric fails, by default it will be sent to the chart owner. If you want additional email carbon copy (CC) recipients, you can now click the Y Limits link to add them.
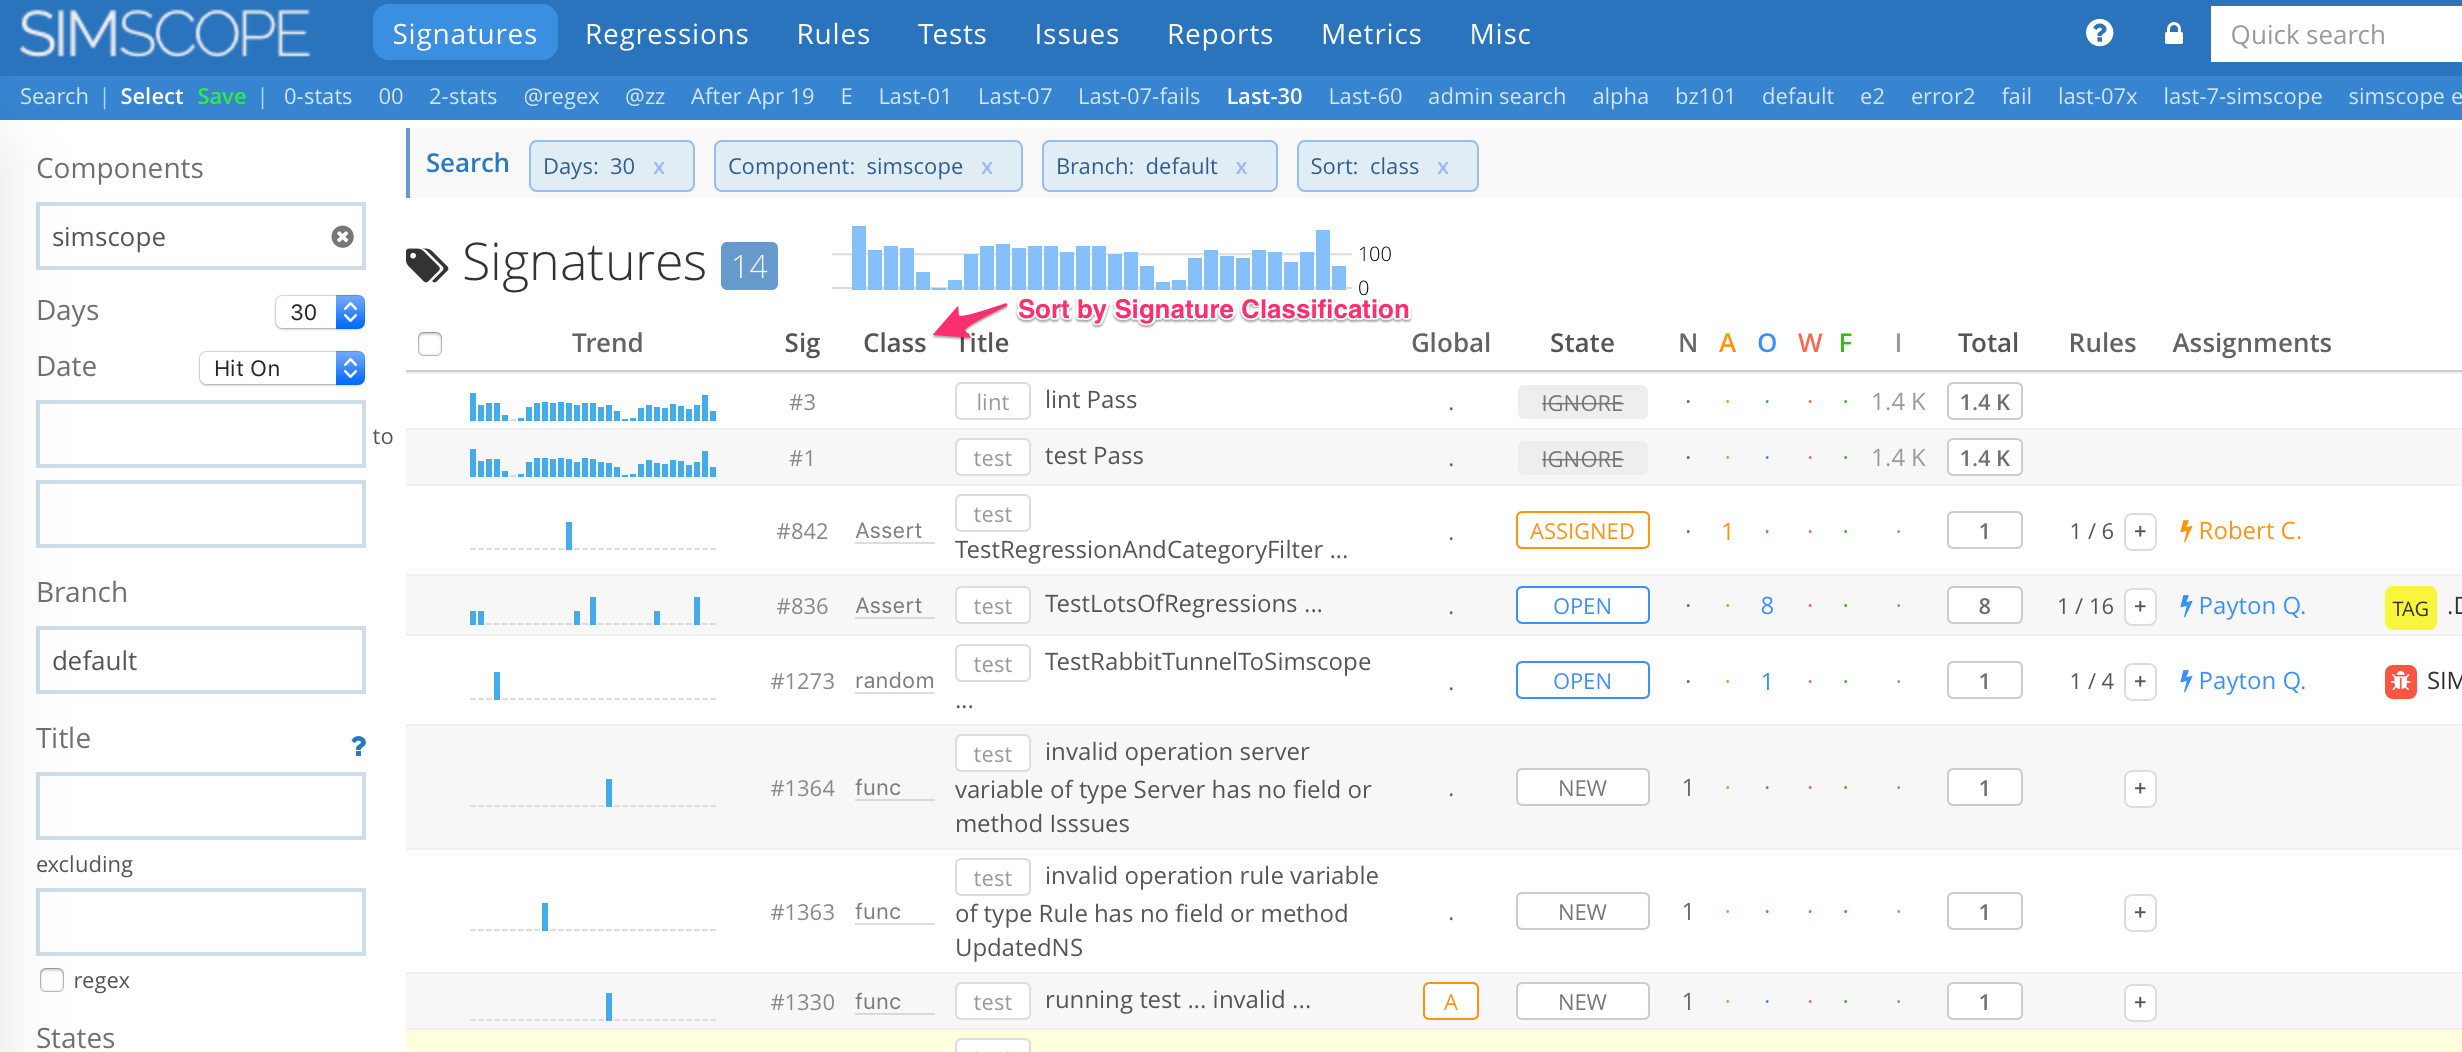
2. Sort Signatures by Classification
Click the Class table link to sort a signature table by classification (if they have been classified).
1.280
- feature →
Rule Nag Emaildaily notifications. - feature →
Rule Nagpage auto-select current user. - feature →
Metrics Weekly short termcharts using regression-based data.
1. Rule Nag
Rule Nag notifies users of Bugs which are likely needing to be resolved in Simscope, based on comparing the Simscope Triage State to Bug Tracker state.
This will send a daily email to users notifying them to either resolve the issue in Simscope or to re-open the bug in your Bug Tracker.
Enabling Rule Nag
Rule Nag is enabled on a per-project basis, so you can turn it on for any project desired.
To enable, add nagemails = true to each [project] you want to enable notifications for
inside your simscope.config file. Here is an example enabling it the acme project:
[project "acme"]
workspacepath = "/path/to/repo"
defaultbranch = "default"

nagemails = true
2. Rule Nag page
The Rule Nag page now shows data for the current Simscope user by default.
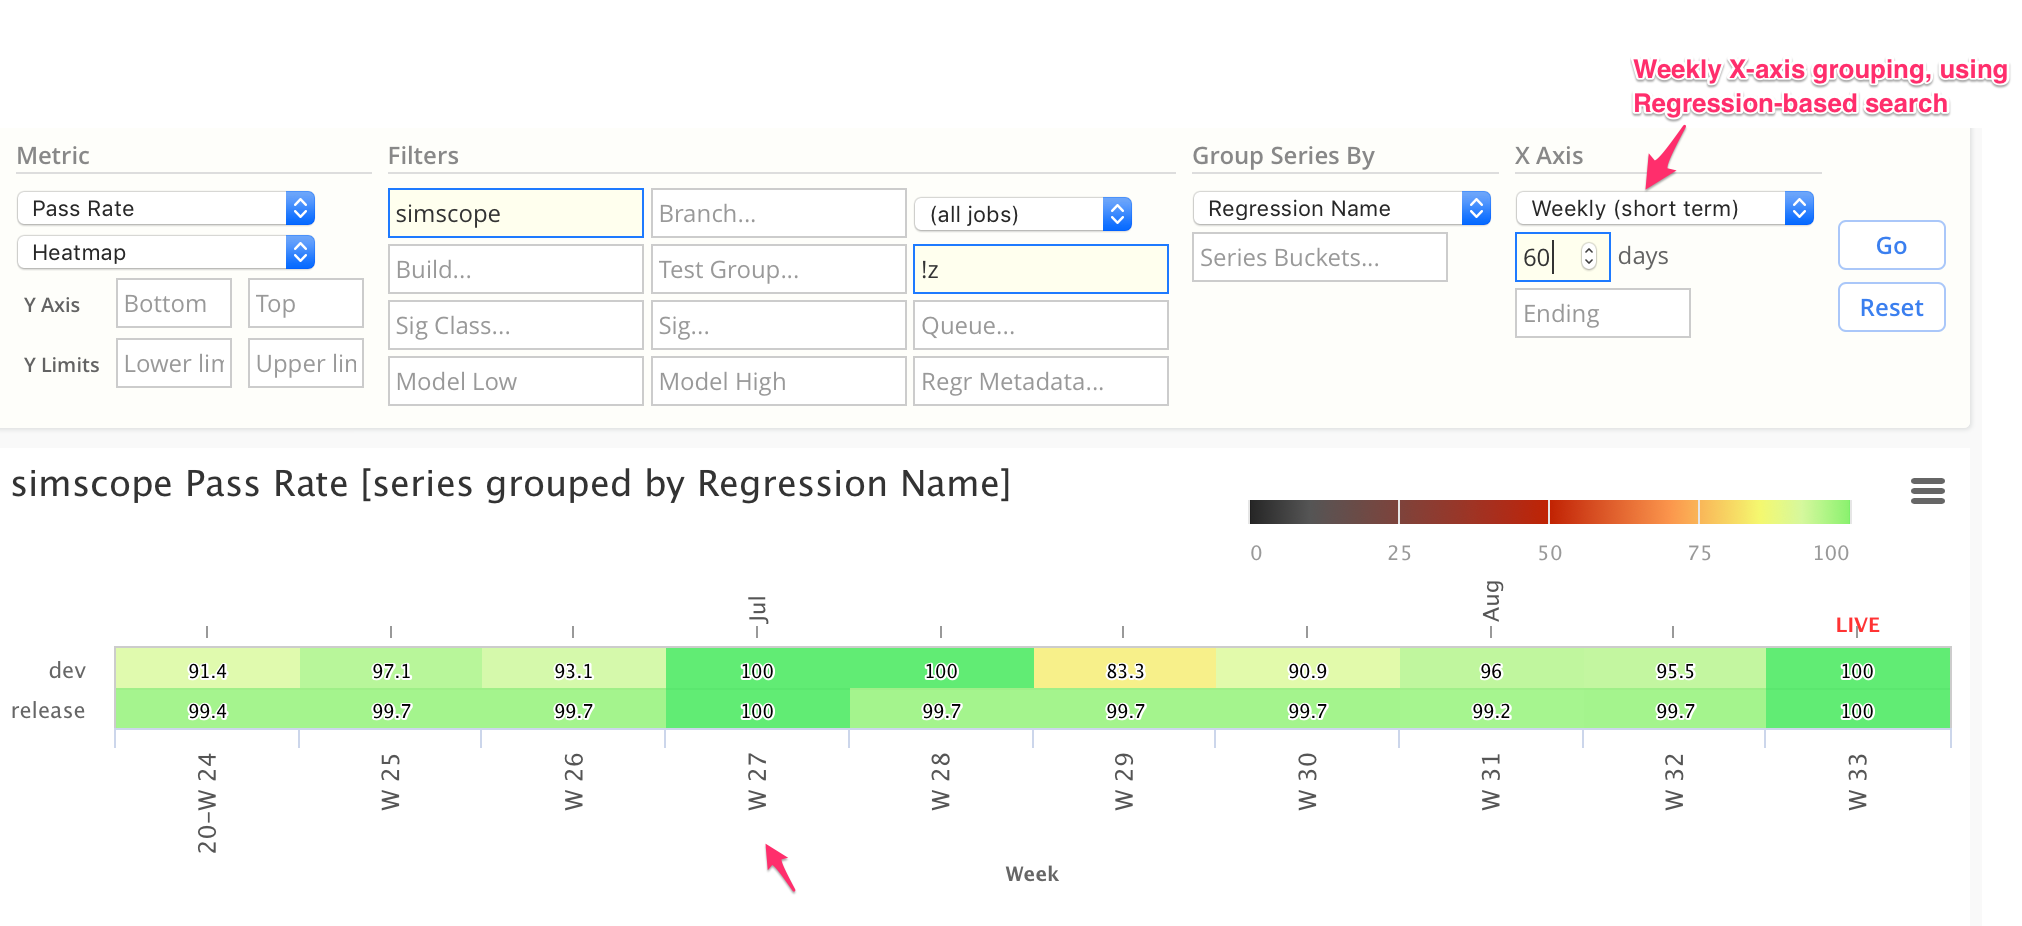
3. Metrics Weekly charts using regression-based filters.
Longer term Weekly charts (ie 6-month, 1-year, etc) use an optimized dataset, which does not have regression-based metadata.
Simscope Metrics can now create weekly-based charts using regression-based filters. This lets you create up to 90-day charts will all the filters available.
Here is an example weekly pass-rate chart, using data from the past 60 days:
