Coverage Search
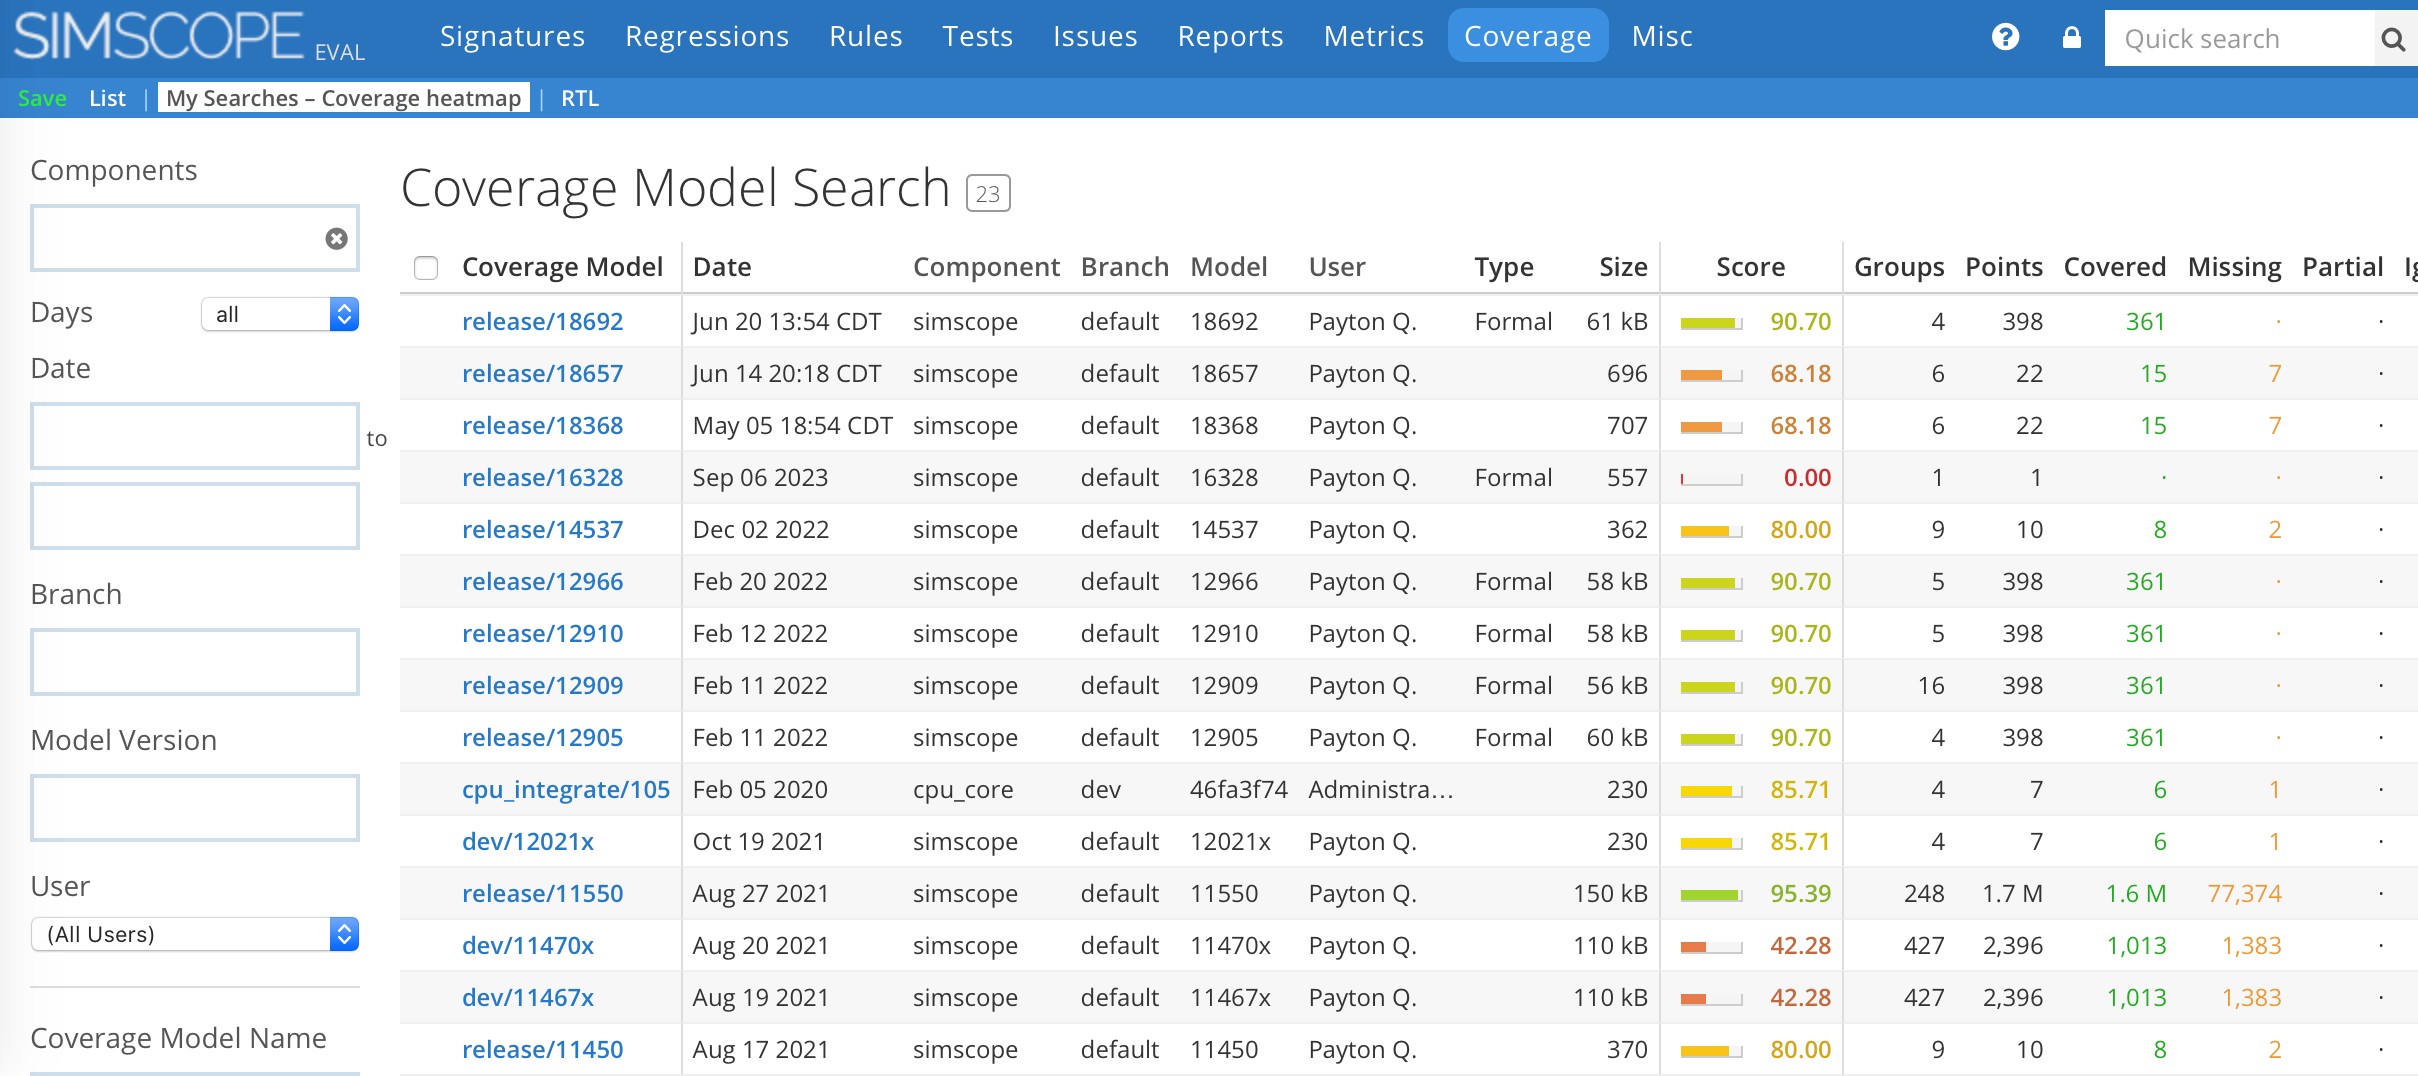
Coverage databases can be searched, and displayed as tables or as charts.
- This enables filtering by component, branch, user, coverage group, etc.
- Also, users can display results in both tabular and chart forms.
Example:
Saved Searches
Coverage search configurations can be saved, restored, and shared among users.
Coverage Charts
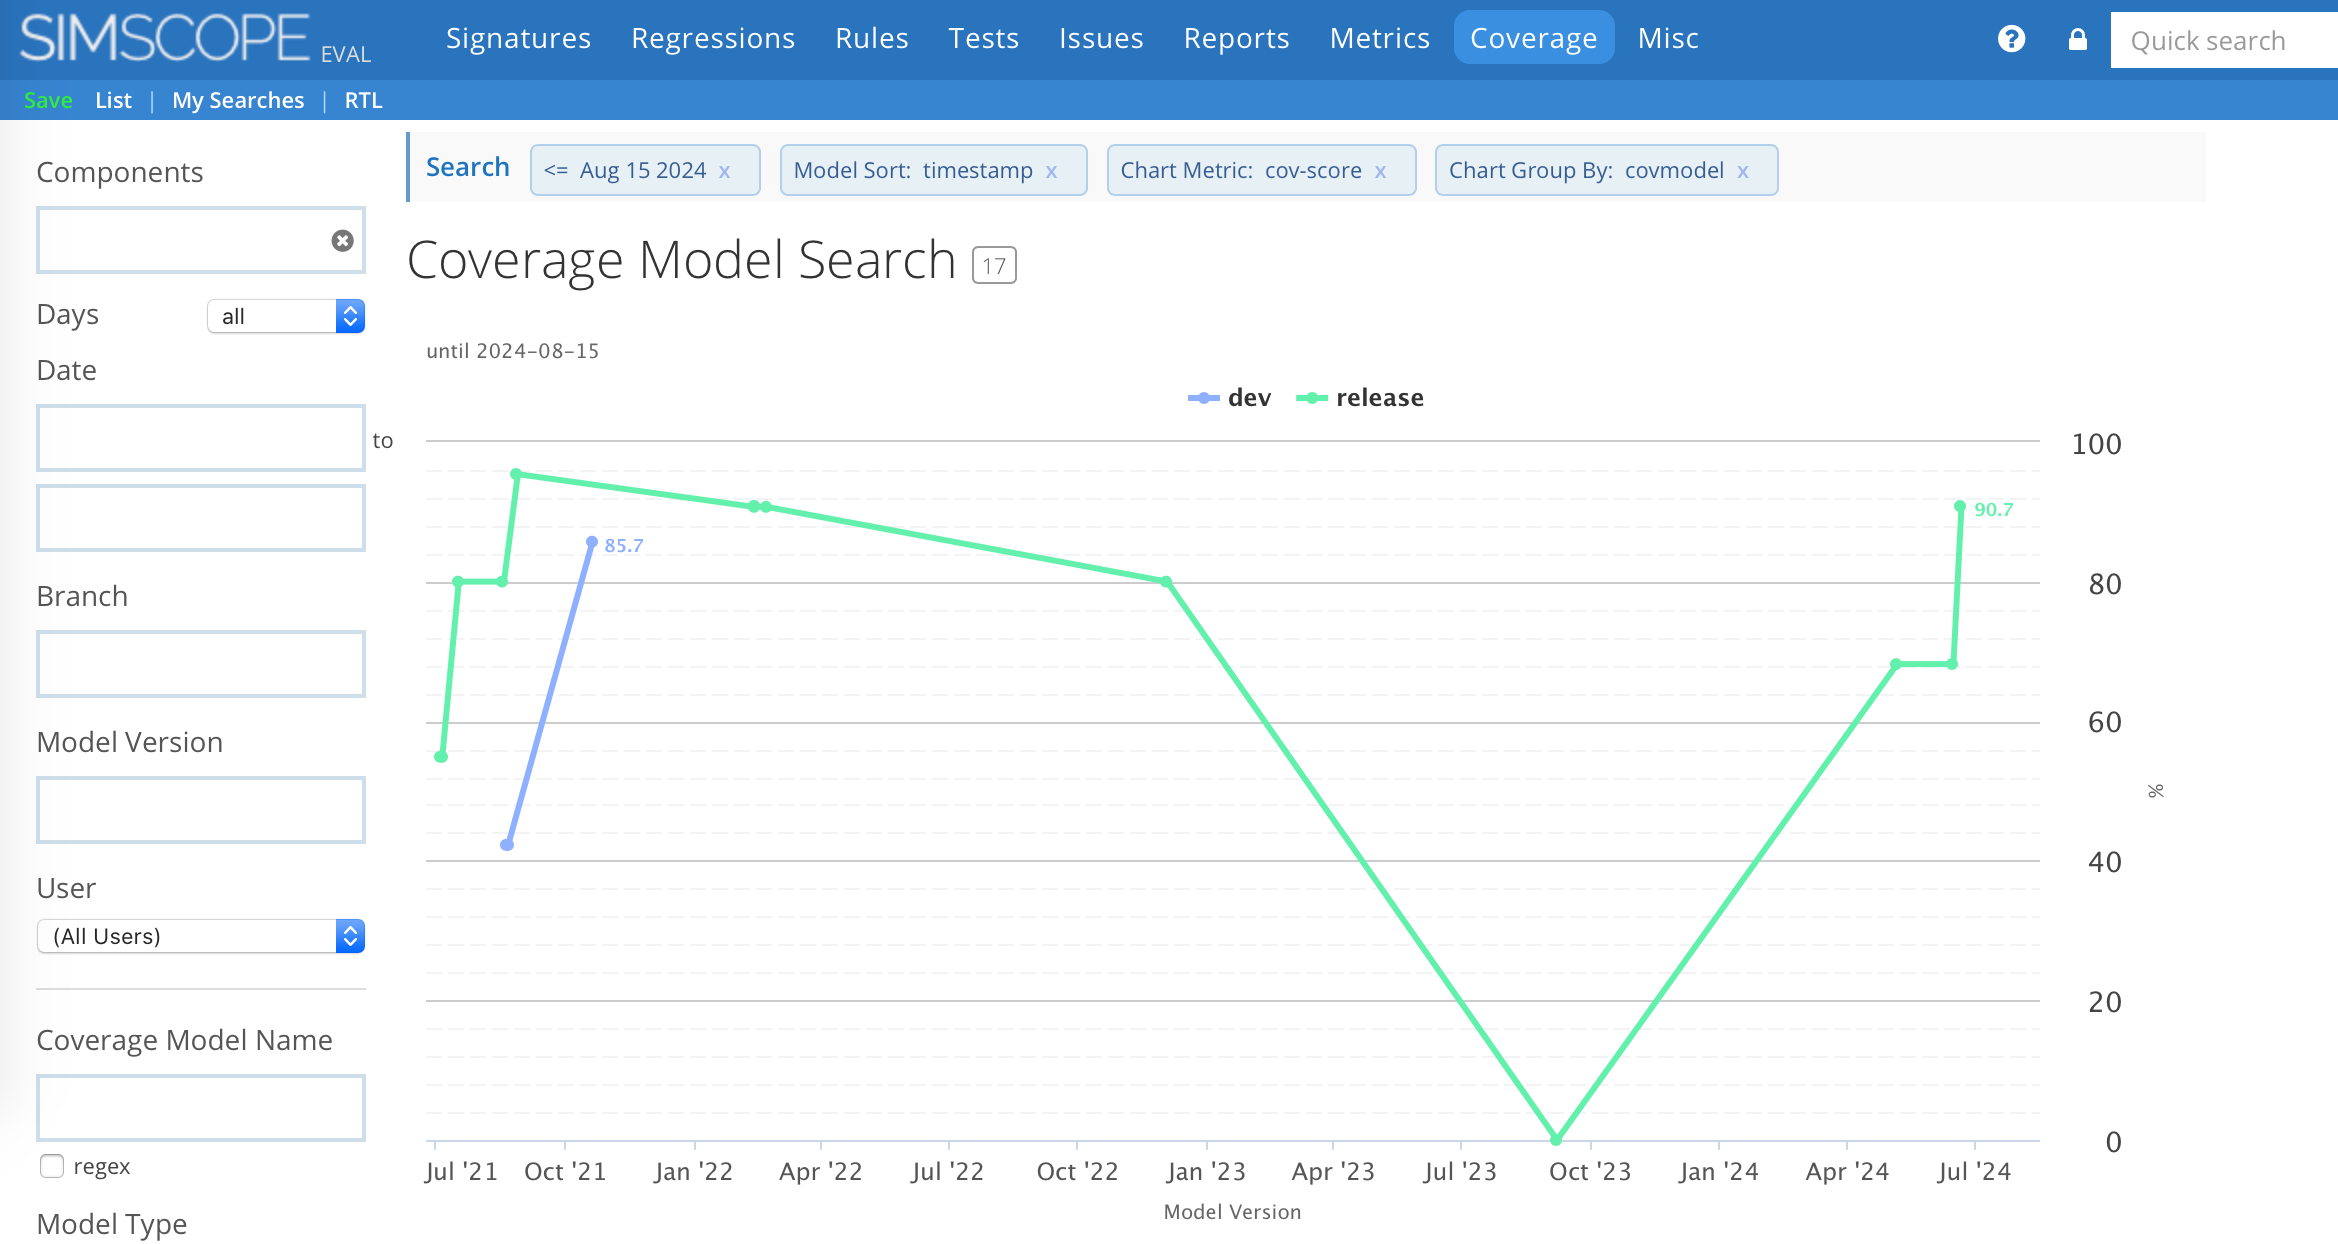
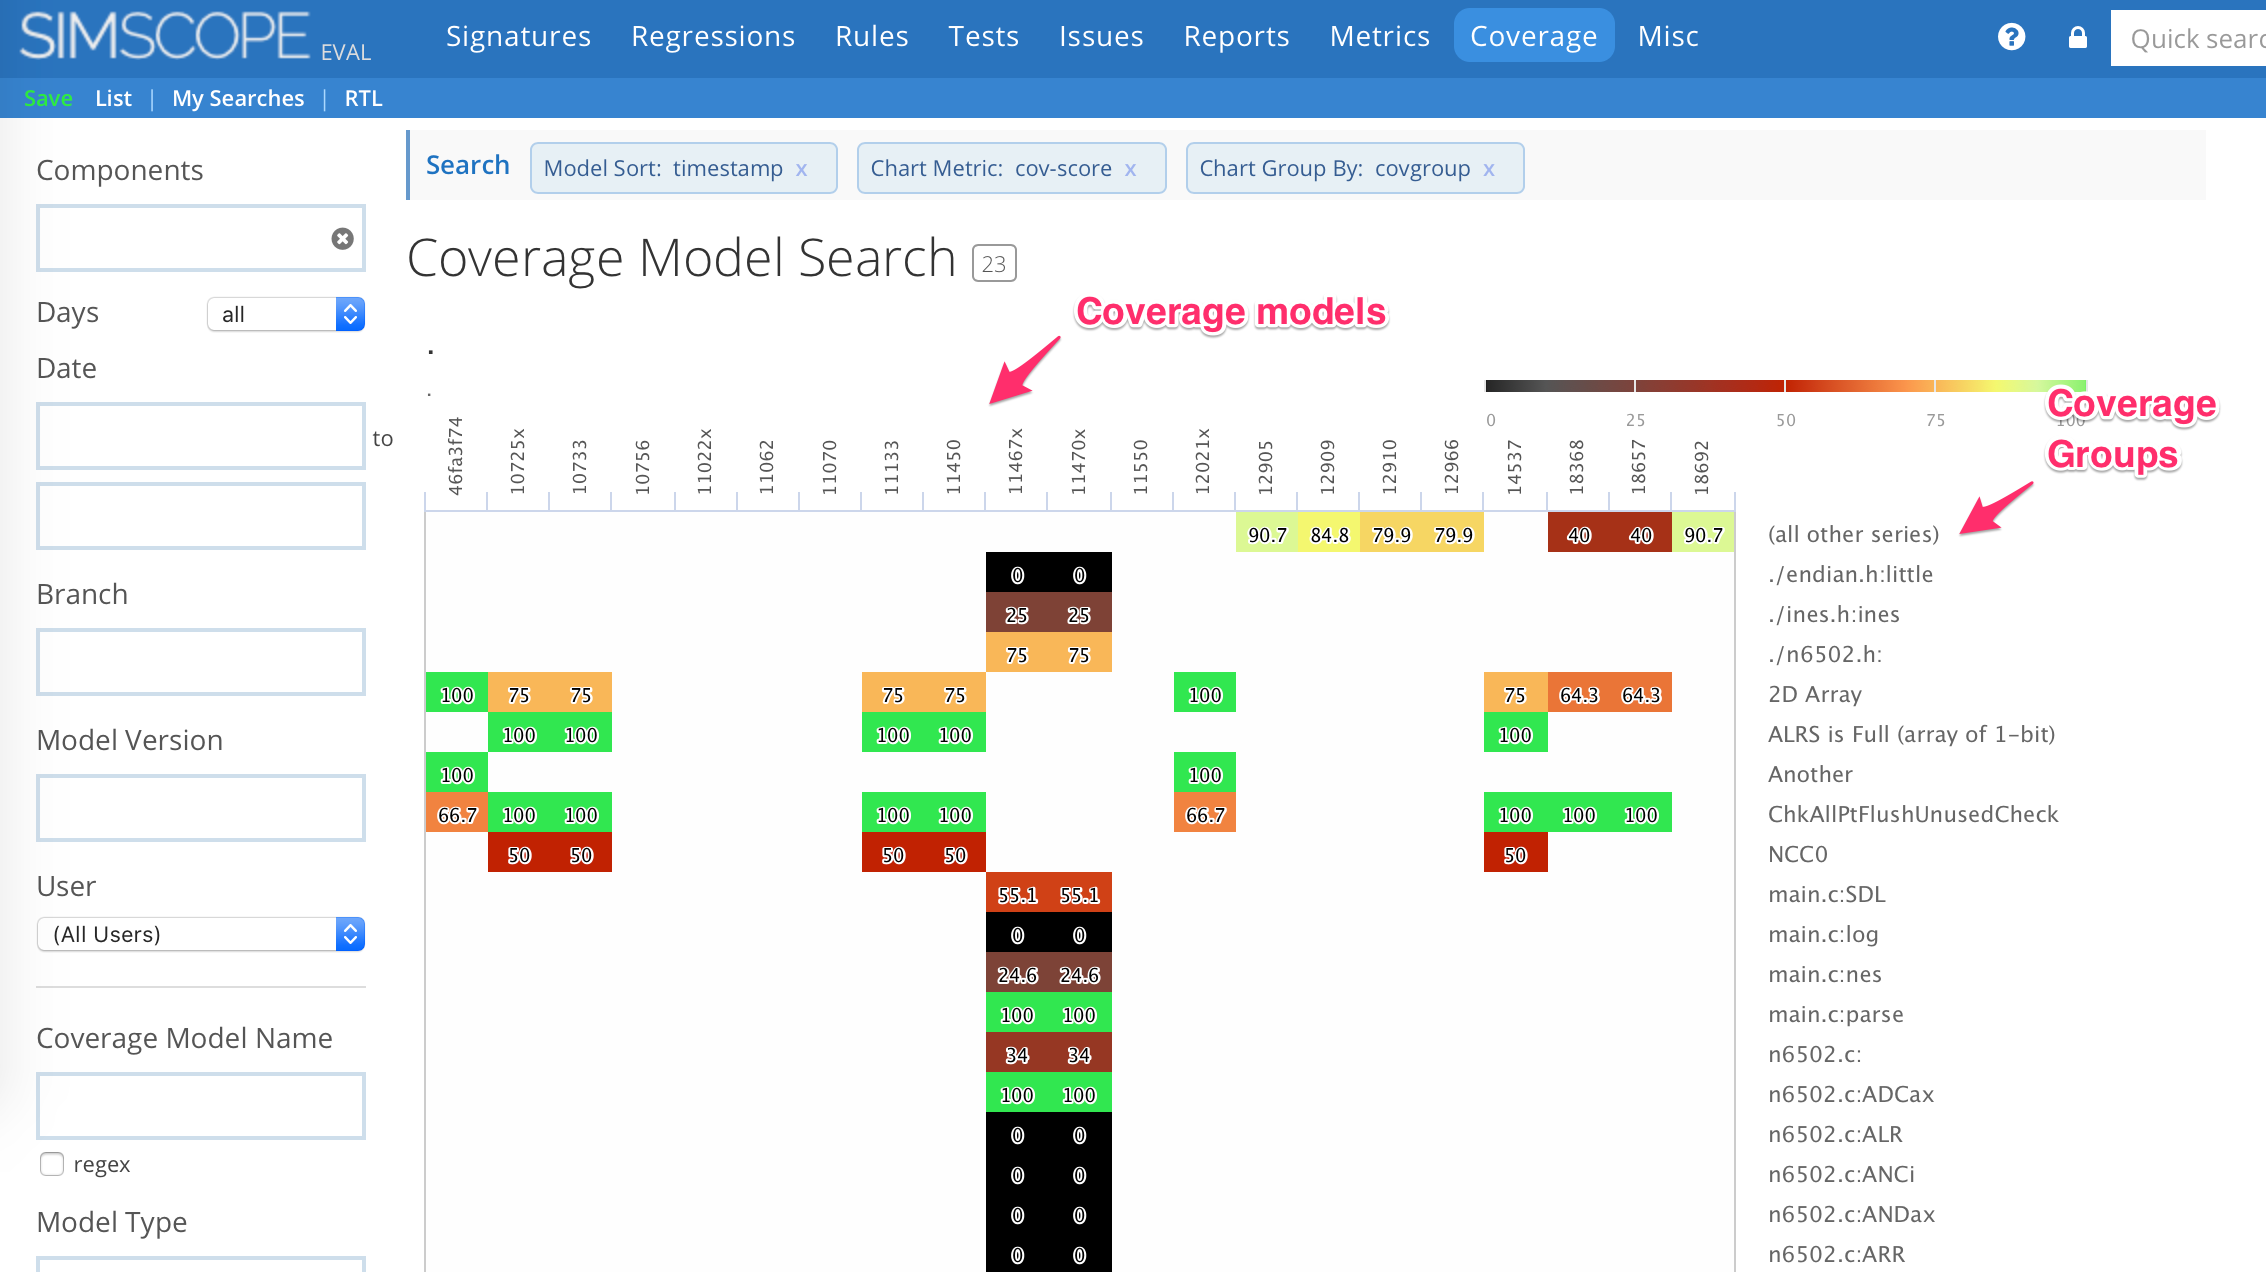
Simscope can display coverage results as line and heatmap charts.
Chart Series can be grouped by:
- Coverage Model
- Coverage Group
Coverage Model Chart
This charts results of combined models over time, as a line chart.
Coverage Group Chart
This charts results of coverage groups over time, as a heatmap.
- Coverage Models are arranged horizontally (left-to-right).
- Coverage Groups are arranged vertically (top-to-bottom).


