Simscope Release History — v440 — 449
1.449
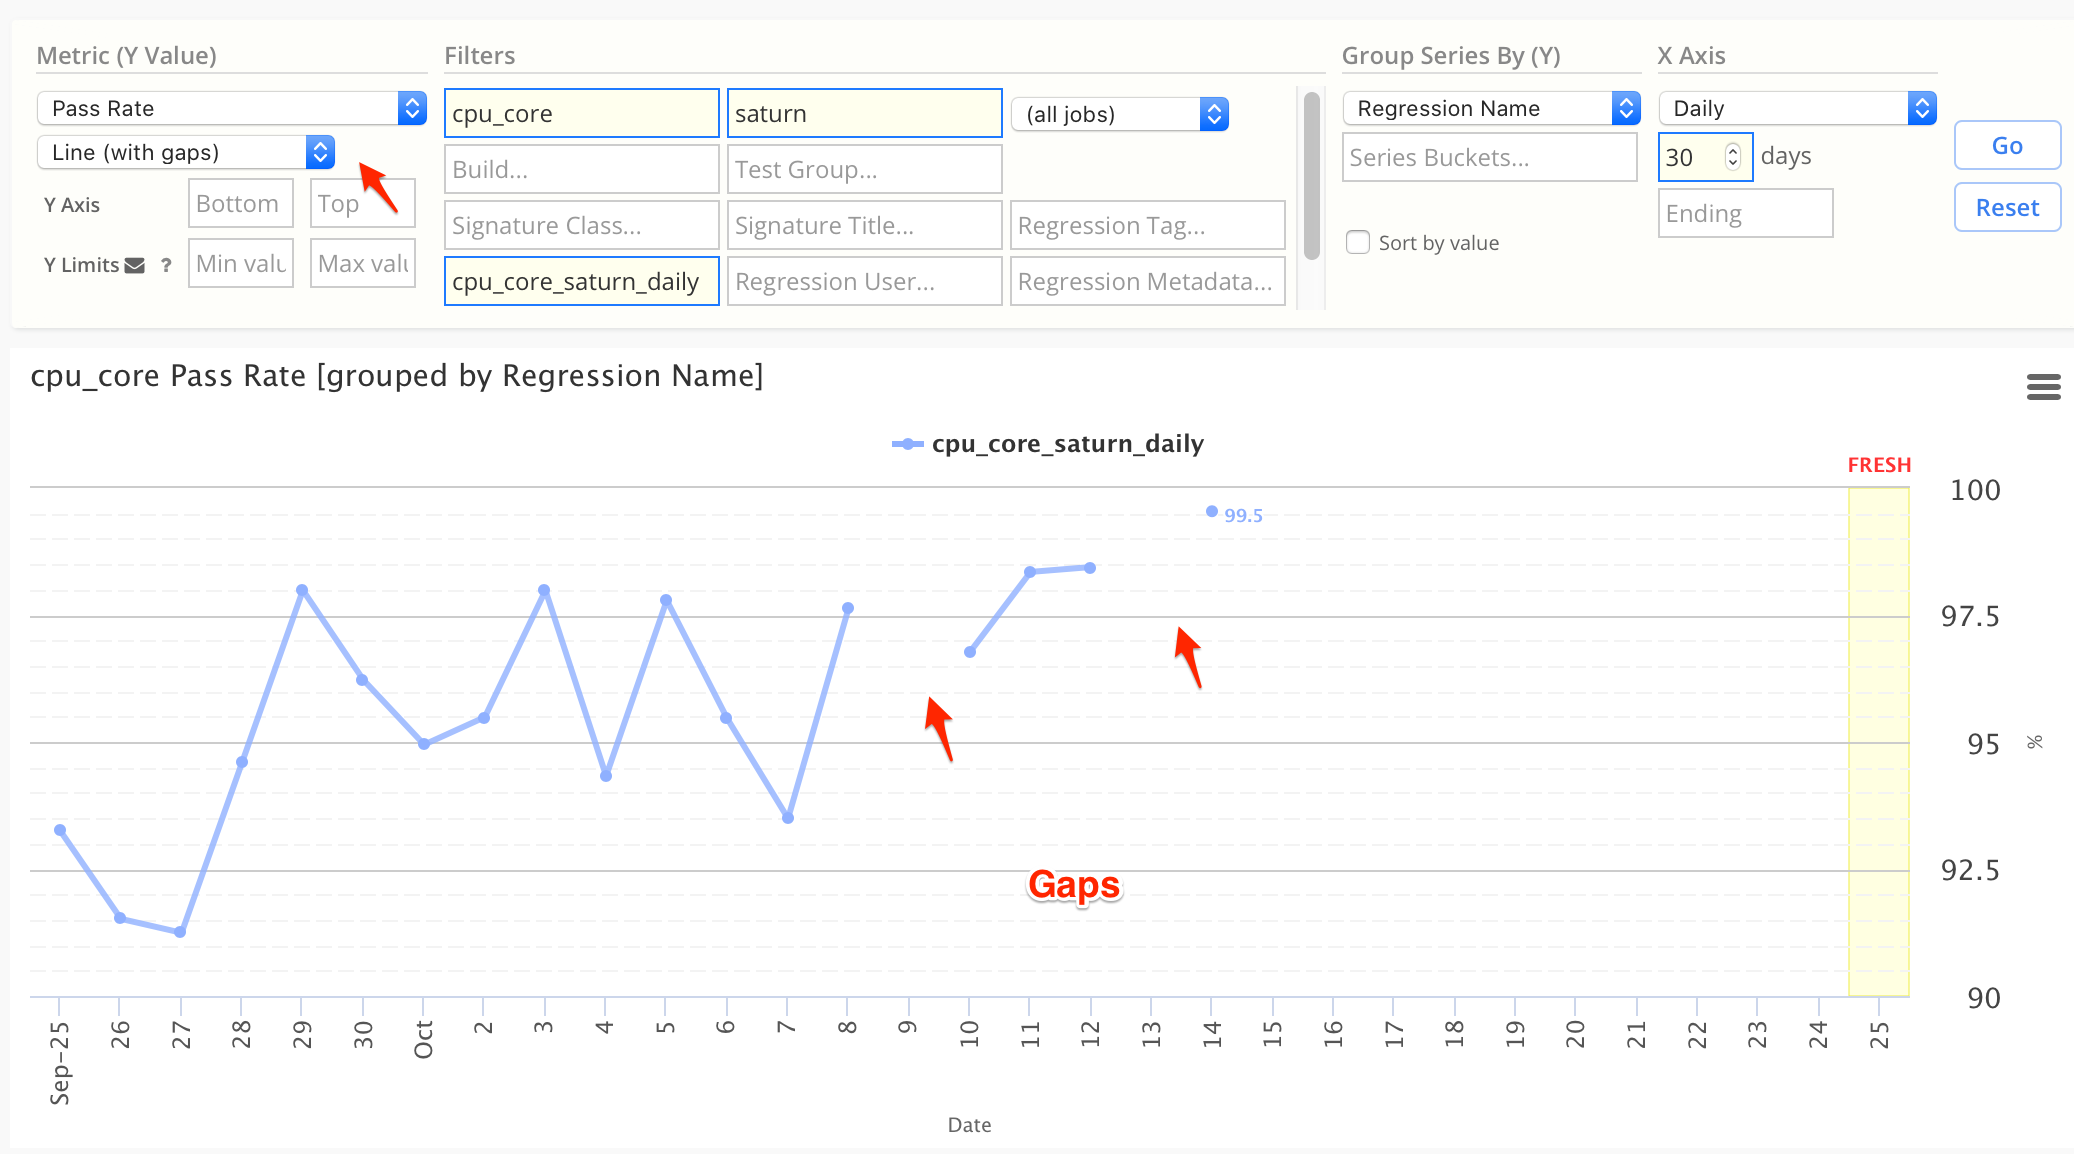
1. feature Connected and gapped Line Charts
Simscope Line Charts now by default leave gaps when series have holes (ie missing data) between days.
- This chart type is called
Line (with gaps) - This makes it more obvious that data is missing.
If you want to render line charts with the old behavior, you can choose Line (connected),
which connects null data gaps.
Here is an example Line chart (with gaps):
2. feature Server Timestamps
Simscope can now be enabled to render server timestamps in the HTML user interface, rather than converting timestamps to the client browser timezone.
To enable rendering of server timestamps, add the following to your simscope.config file:
[server]
# Enabling Server Timestamps makes Simscope render display timesetamps in the server's timezone, irrespective of the client browser timezone.
# This disables dynamic Javascript timestamp behavior.
servertimestamps = true
3. feature Enable Job Assignment self-emails
By default, if a user assigns jobs or a rule to themselves, Simscope does not self an email.
If users want to get emails always, add this to your simscope.config file:
[smtp]
# Email self: enables sending emails where the job assignment recipient is the same user as the session user.
# If false, Simscope will discard assignment emails sent to self-users.
emailself = true
4. feature Improved JSON error handling to show parse error context
If JSON files are published and fail due to a parse error, Simscope and Tunnel will now print surrounding content of the error, to give potential context of the problem.
For example, here is an example end-of-JSON input error:
Tunnel Message publish failed JSON validation {type=job-finish path=<stdin>}:
───── Line 1, Column 2 ─────
{
 └─── unexpected end of JSON input
5. bugfix Missing ABORTED on metadata dashboard
On the Metadata Dashboard, regressions which have aborted now show up with a tag to indicate this.
6. bugfix Improved warning message on Test Diff
If test list diff hits the diff limit, the warning message is improved.
1.448
1. bugfix Changed user login to be case-insensitive
Users can now log in with their username in uppercase or lowercase format (ie case insensitive). Passwords are still case sensitive.
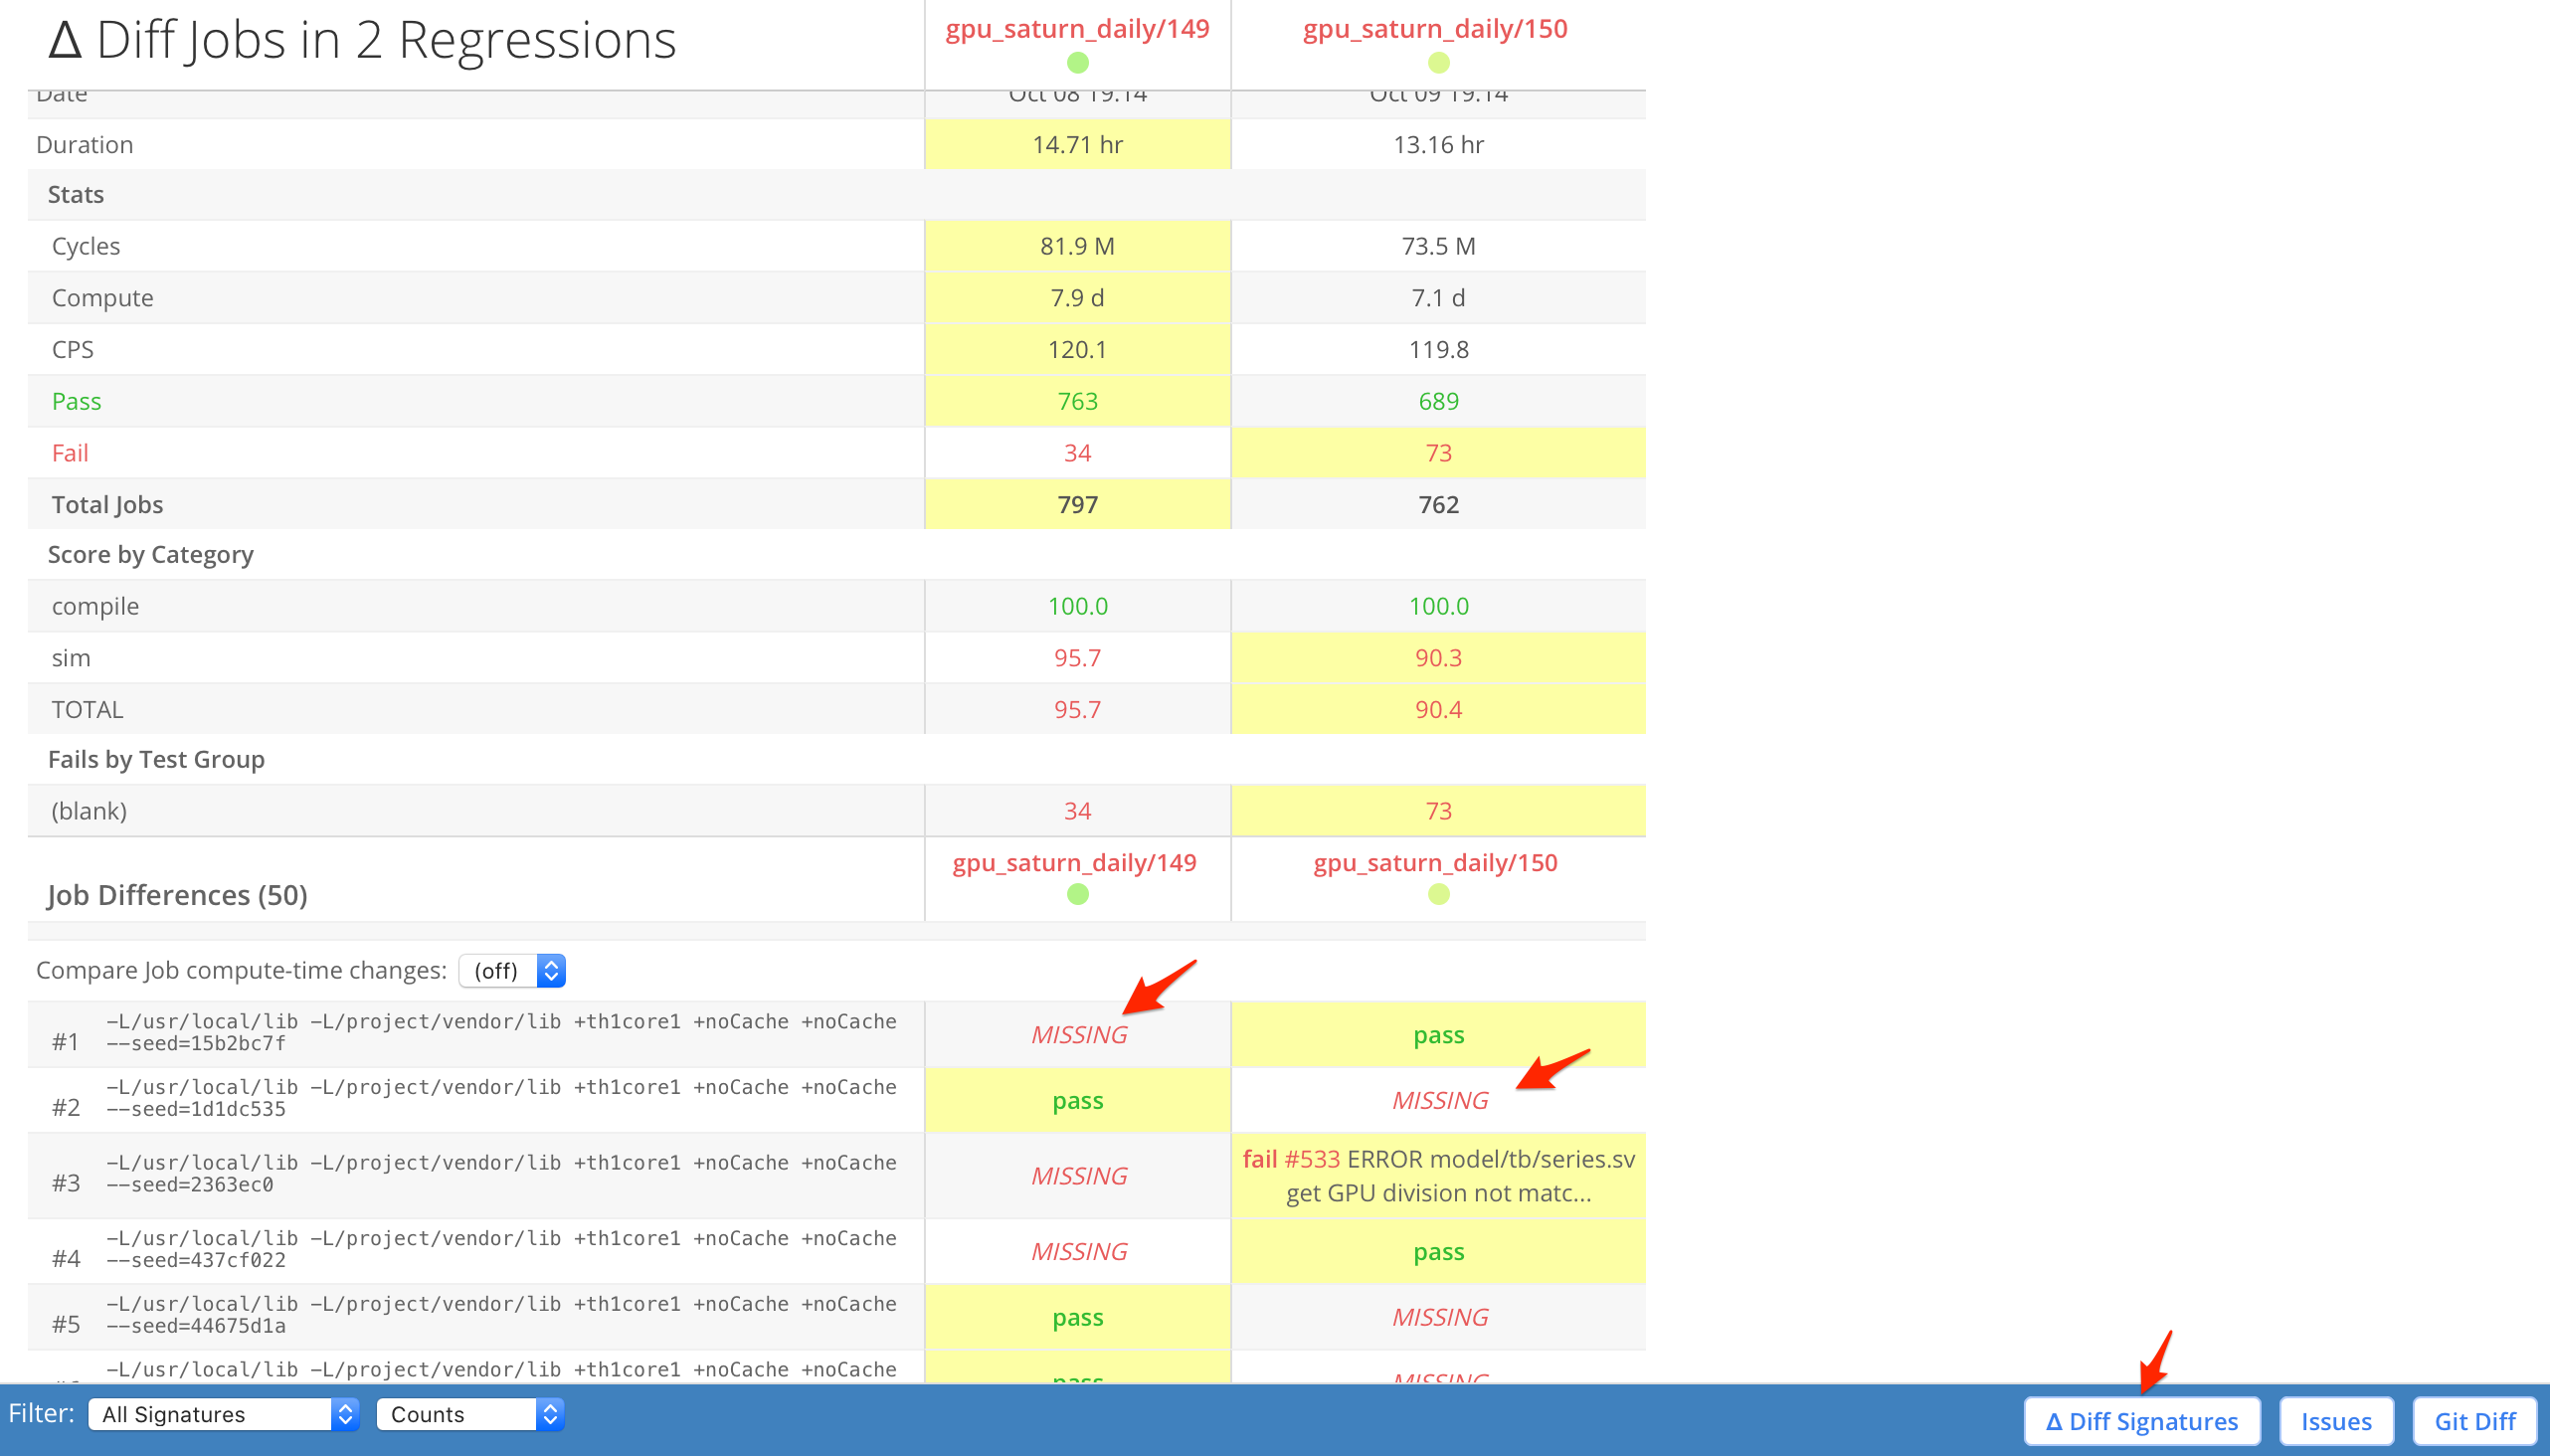
2. feature Added missing tests when diffing Regression Jobs
Regression Compare now shows Missing jobs when diffing regressions.
- This allows you to compare a good regression, and an Abort regression, to determine which jobs were lost.
Here is an example screenshot:
3. feature Added simscope-user-activity script
Added simscope-user-activity, to enable dumping of Simscope user job assignment activity,
from the command-line.
- This script can be customized to print in your desired format.
4. feature Changed all scripts to use Python 3
All Simscope Python client and scripts are now changed to Python3, and Python2 support is now deprecated.
1.447
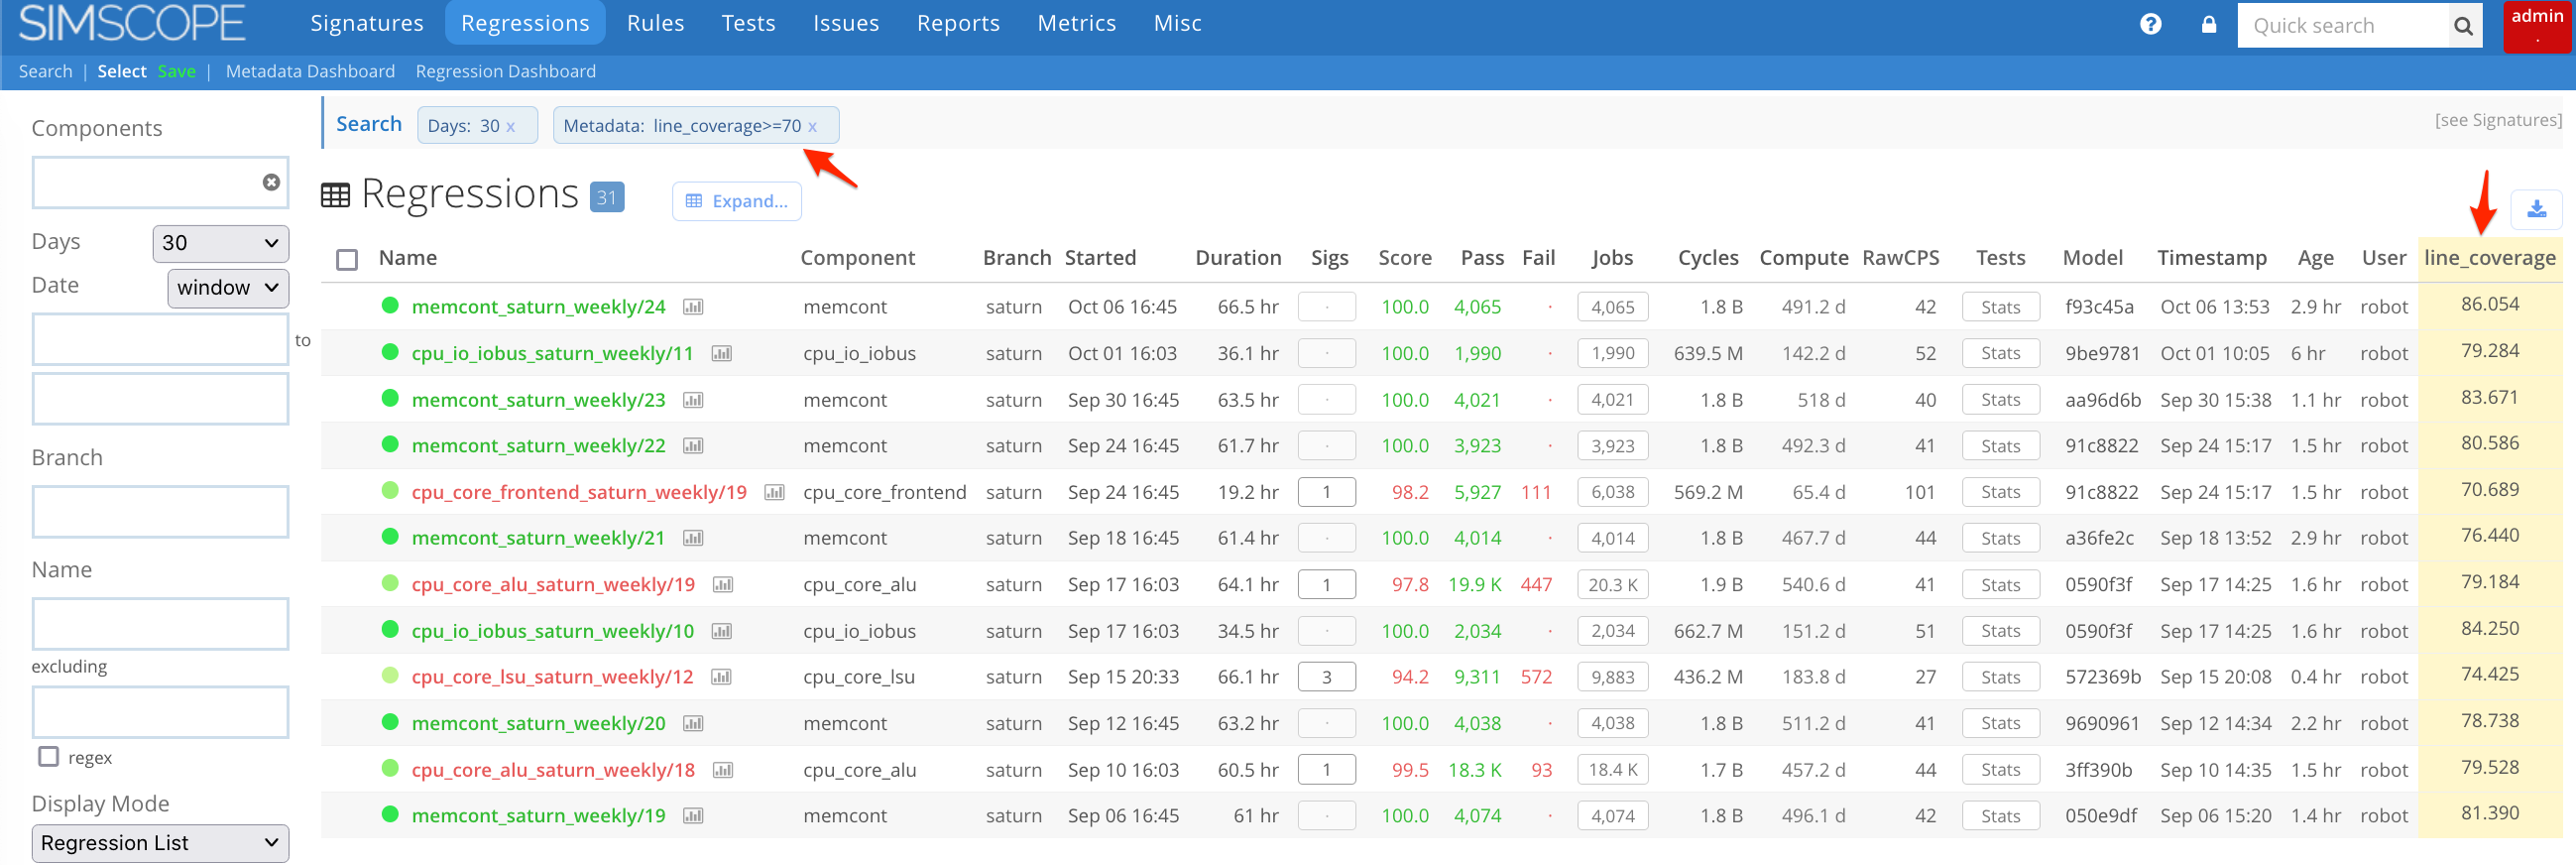
1. feature Filter regression metadata by numeric value (boolean)
Regression metadata can be filtered based on their numeric value, any of the following boolean comparison operators:
=>>=<<=
For example, to filter regressions containing line_coverage with a value at least 70%:
line_coverage>=70
2. feature Show/hide Regression Metadata columns in the search table
Simscope now shows Regression metadata columns matching regular expressions in your search. Multiple metadata columns should be separated by commas:
- To show regressions containing
line_coverage, use:line_coverage
- To show regressions containing
line_coverageandfunc_coverage, use:line_coverage,func_coverage
- To show all metadata columns, use:
.(regexdotindicates match anything)
- To filter regressions containing
line_coverageand then show all metadata, use:line_coverage,.
1.446
1. feature Added Regression Diff from the Regression Metadata Dashboard
When browsing the Regression Metadata Dashboard, two or more Regressions can now be checked and then Compared.
2. bugfix Added Metadata scrolling on Regression Diff
Regression Diff now includes a scroll box, if regressions contain many metadata.
3. bugfix Batch of bug fixes for charts
This release includes a batch of bug fixes in Charts:
- Fixed line chart data label cropping bug
- Fixed tooltip metric z-index bug (modal mode -- fullscreen)
- Fixed regression coverage heatmap bug
- Fixed weekly heatmap bug, where the X-axis displayed
NaN - Fixed heatmap limit bug: aggregated X-axis charts now can click to drilldown
4. feature Configurable chart X-axis maximum columns
Increased default X-axis columns from 50 to 200
- Also, these can be changed via the
[chart].maxcolumnsconfig variable
5. feature Improvements to simscope-sig-testlist script
The simscope-sig-testlist script now emits regression info at the
top of the output (regression name, branch, model), to help with reproducing test failures.
6. feature Improvements to Simscope homepage
The Simscope homepage now shows 10-day heatmaps of Regression pass rates and Component signature counts.
1.445
1. feature Improvements to charts
Variety of improvements to charts:
- Heatmap color axis shrunk on dashboards and embedded charts.
- Bar charts have improved gaps between series.
- Improved Y-axis tick marks on bar and area charts.
- Changed the Chart Save button to be green
2. feature Increase Admin warning log size
Increased the Simscope in-memory Admin warning log from 512kB to 2MB.
3. feature Filter signatures by Regression Tag
SIMSCOPE-68
Signatures can now be filtered by Regression Tag field.
4. bugfix Javascript warning fixed
Fixed a Javascript warning found in Edge browser.
1.444
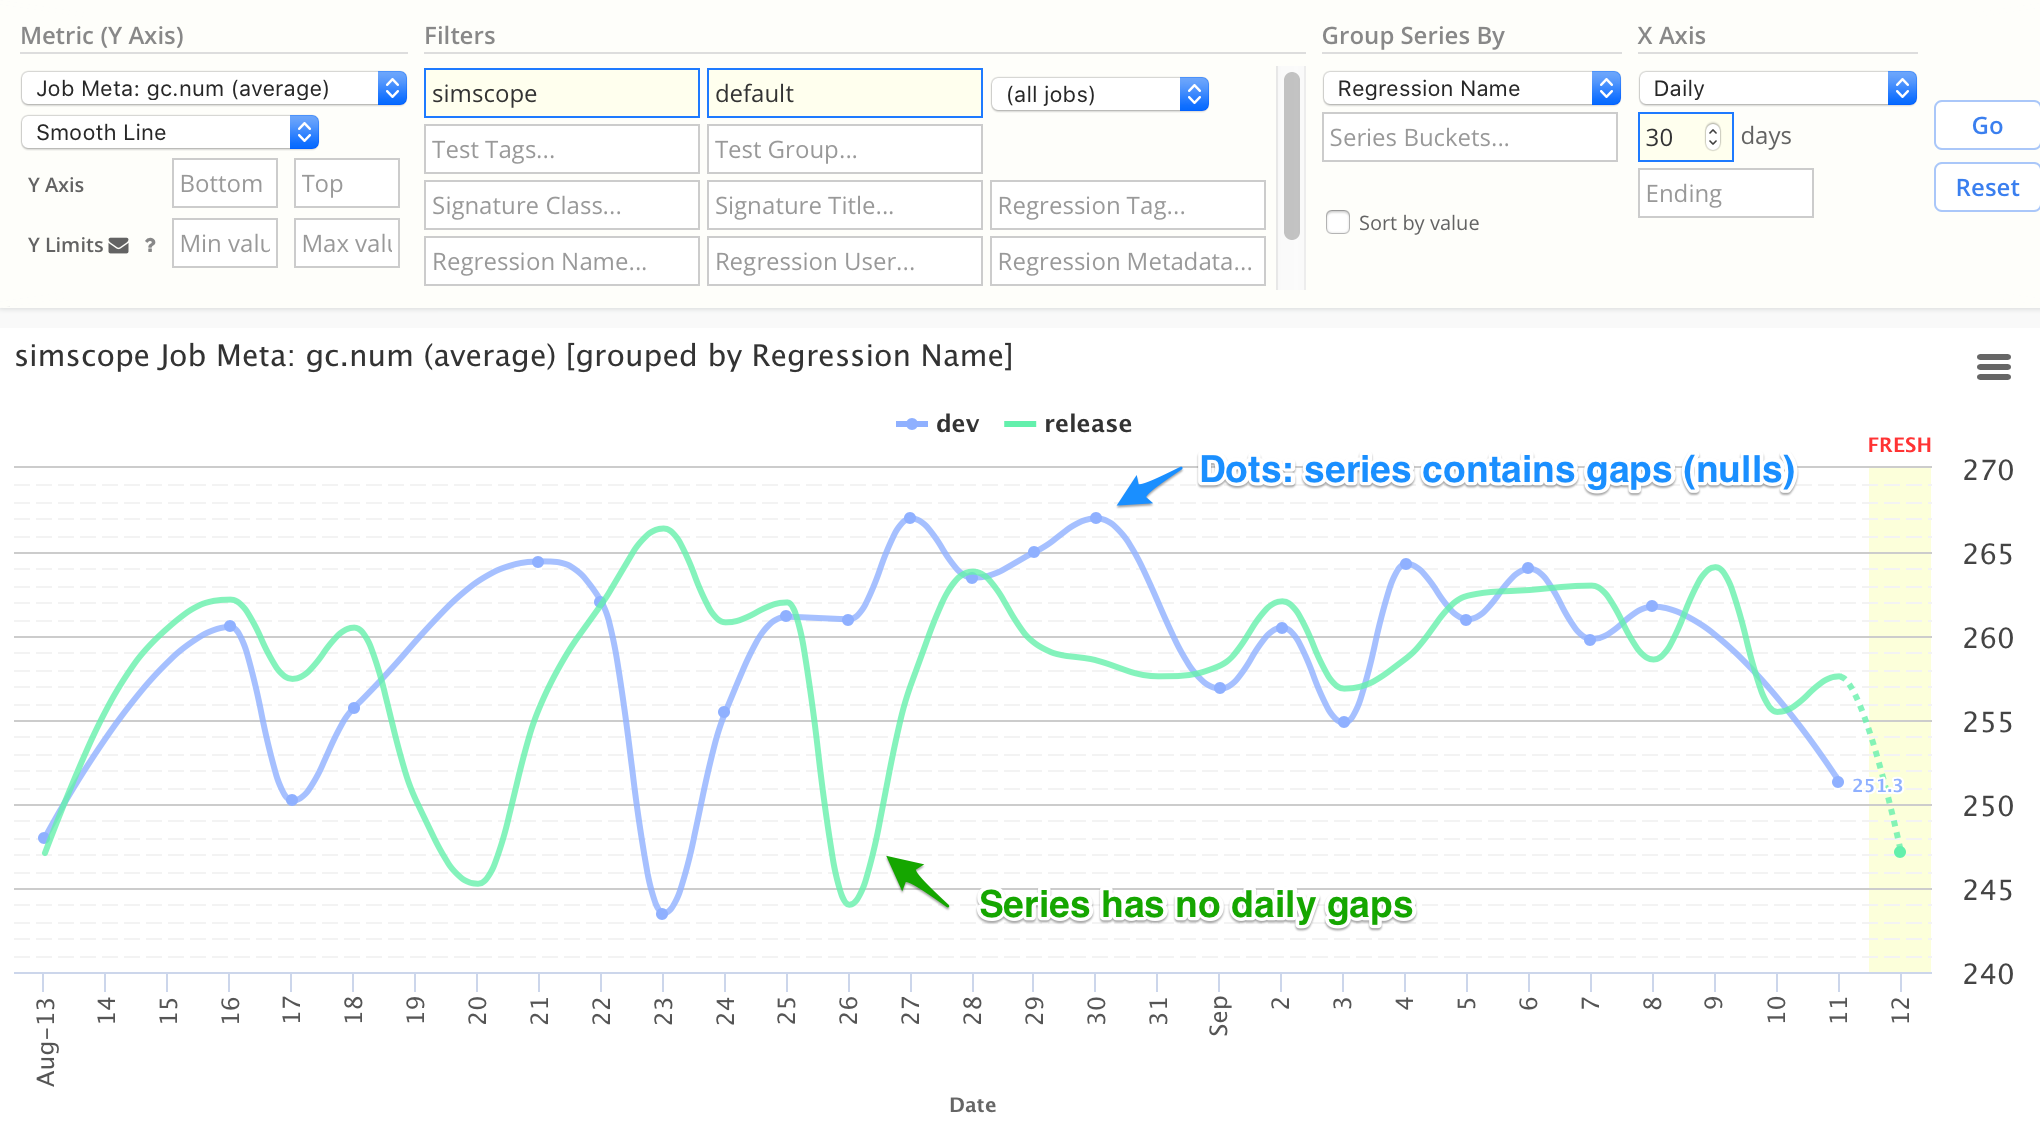
1. bugfix Improved charts with null values
If line and area charts contain gaps in the series data (i.e. null data values),
Simscope will now render the series with a dot at each valid value, to make it more
obvious where gaps in the series exist.
- If the series contains no
nullgaps, dots will be omitted in the chart.
Here is an example chart screenshot, showing both a series with data gaps (dots) and one without gaps (no dots):
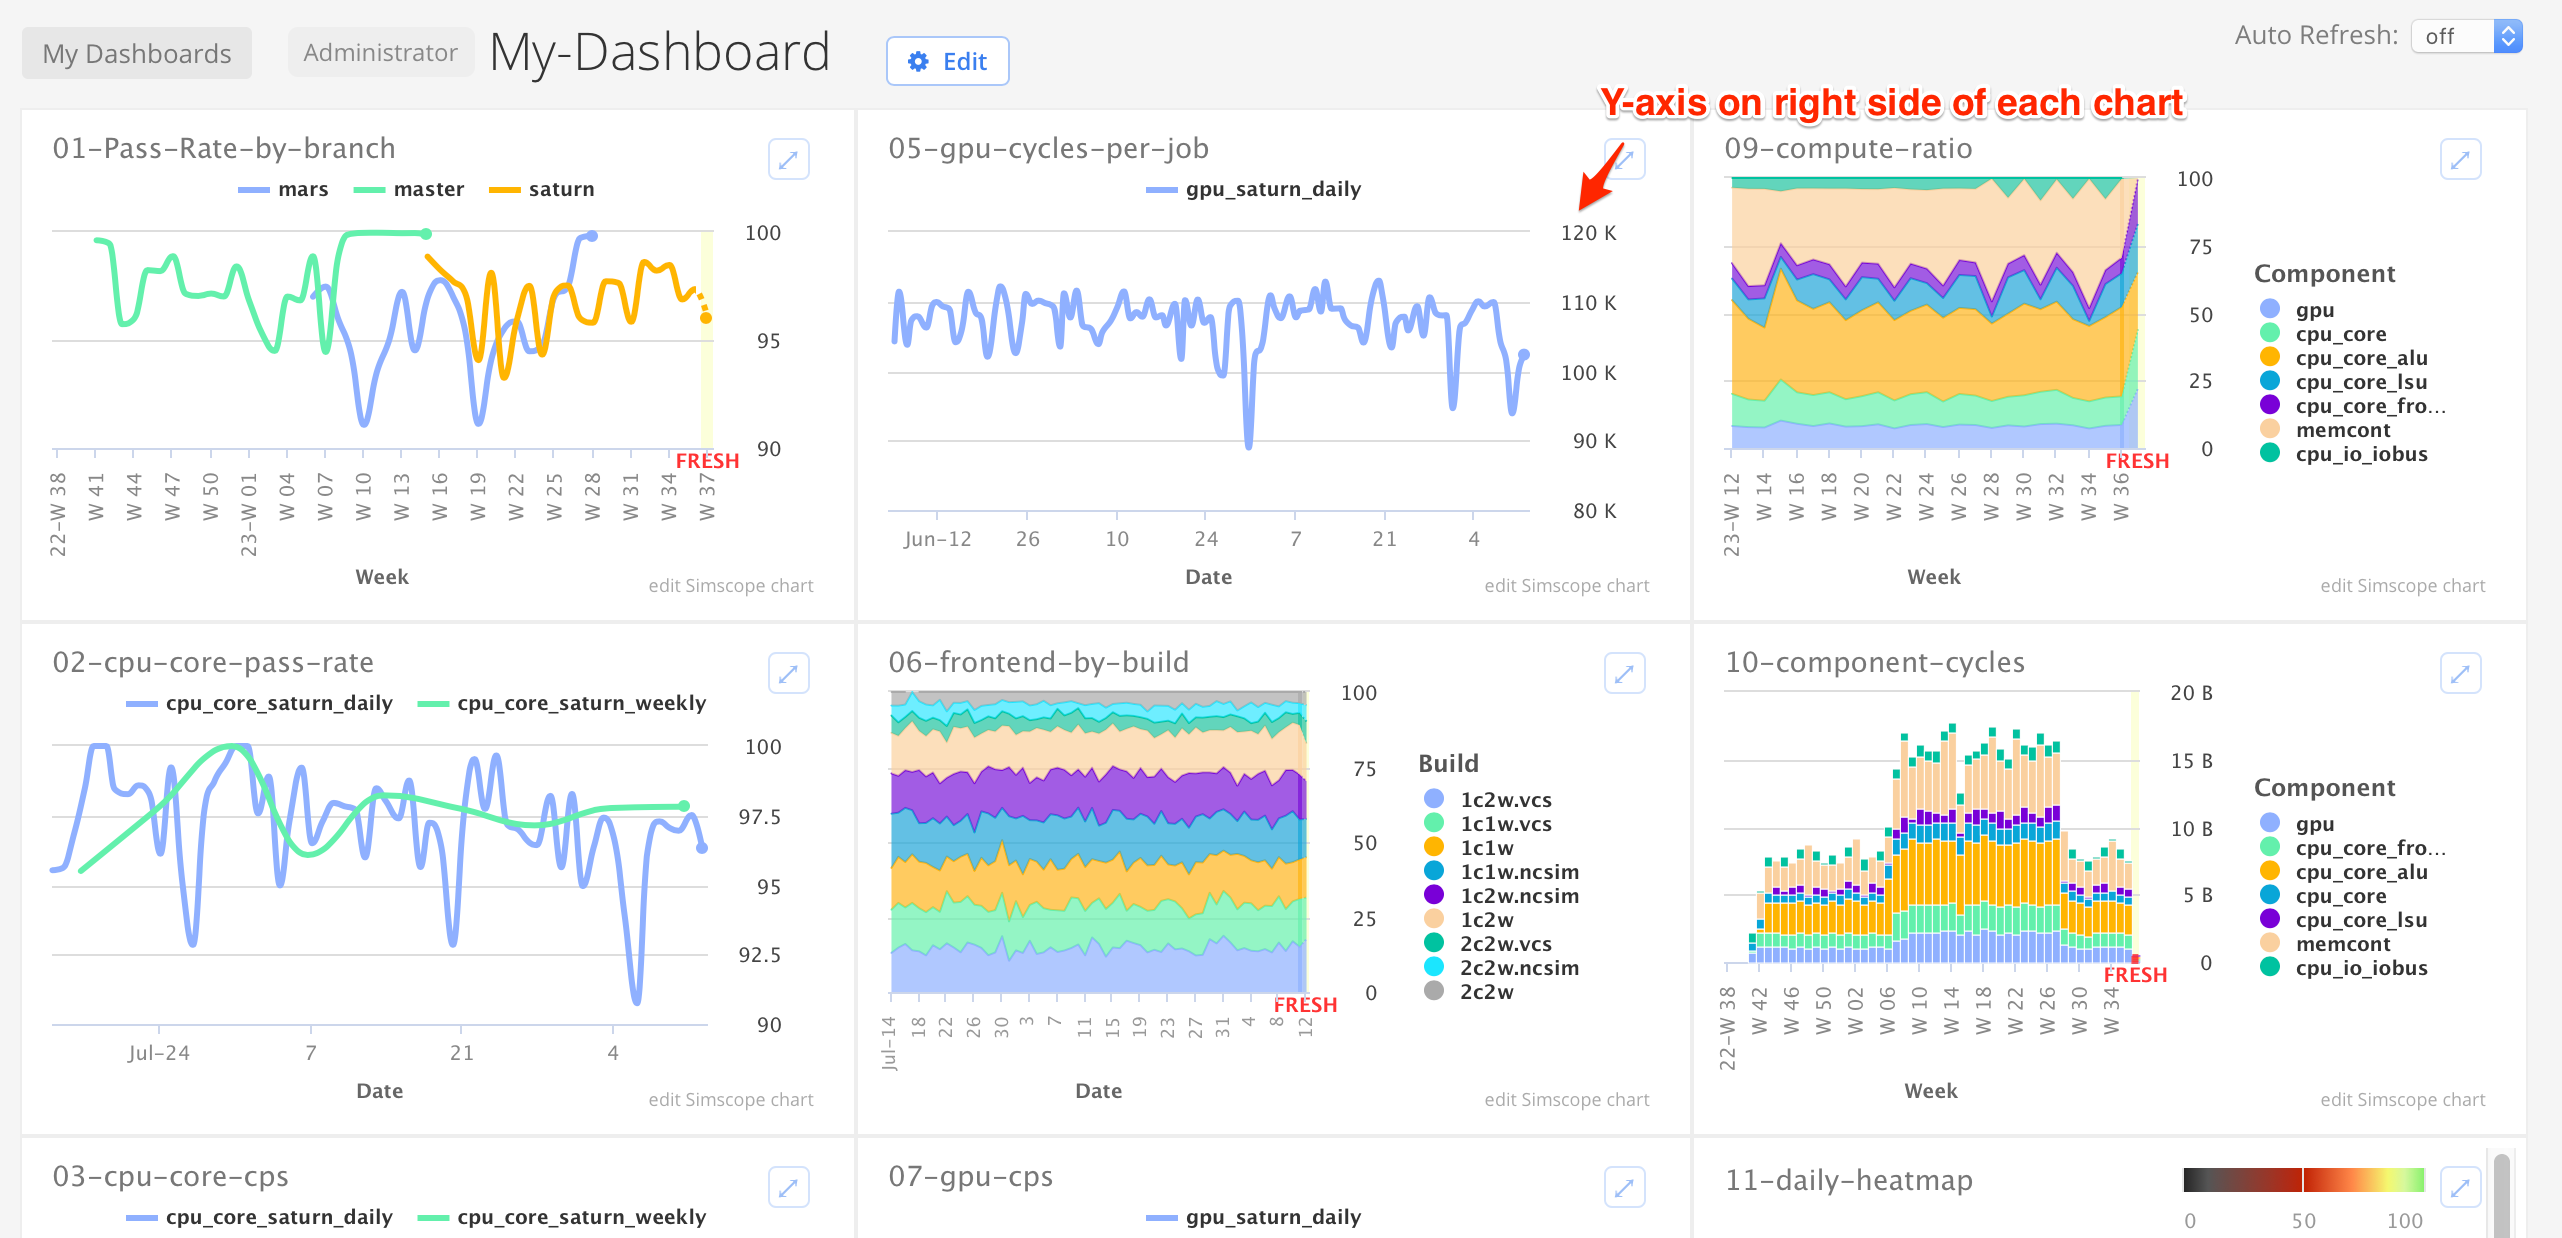
2. bugfix Embedded chart Y-axis on right side
Previously, embedded and dashboard charts rendered the Y-axis on the left side of charts.
3. bugfix Improved ignore coverage
Coverage DB's solely containing ignore coverage properties are now allowed.
- Ignore properties are determined via
status=ignore - Previously, these DB's would be rejected when publishing, as Simscope was expecting at least
one
pass,fail, orpartialproperty.
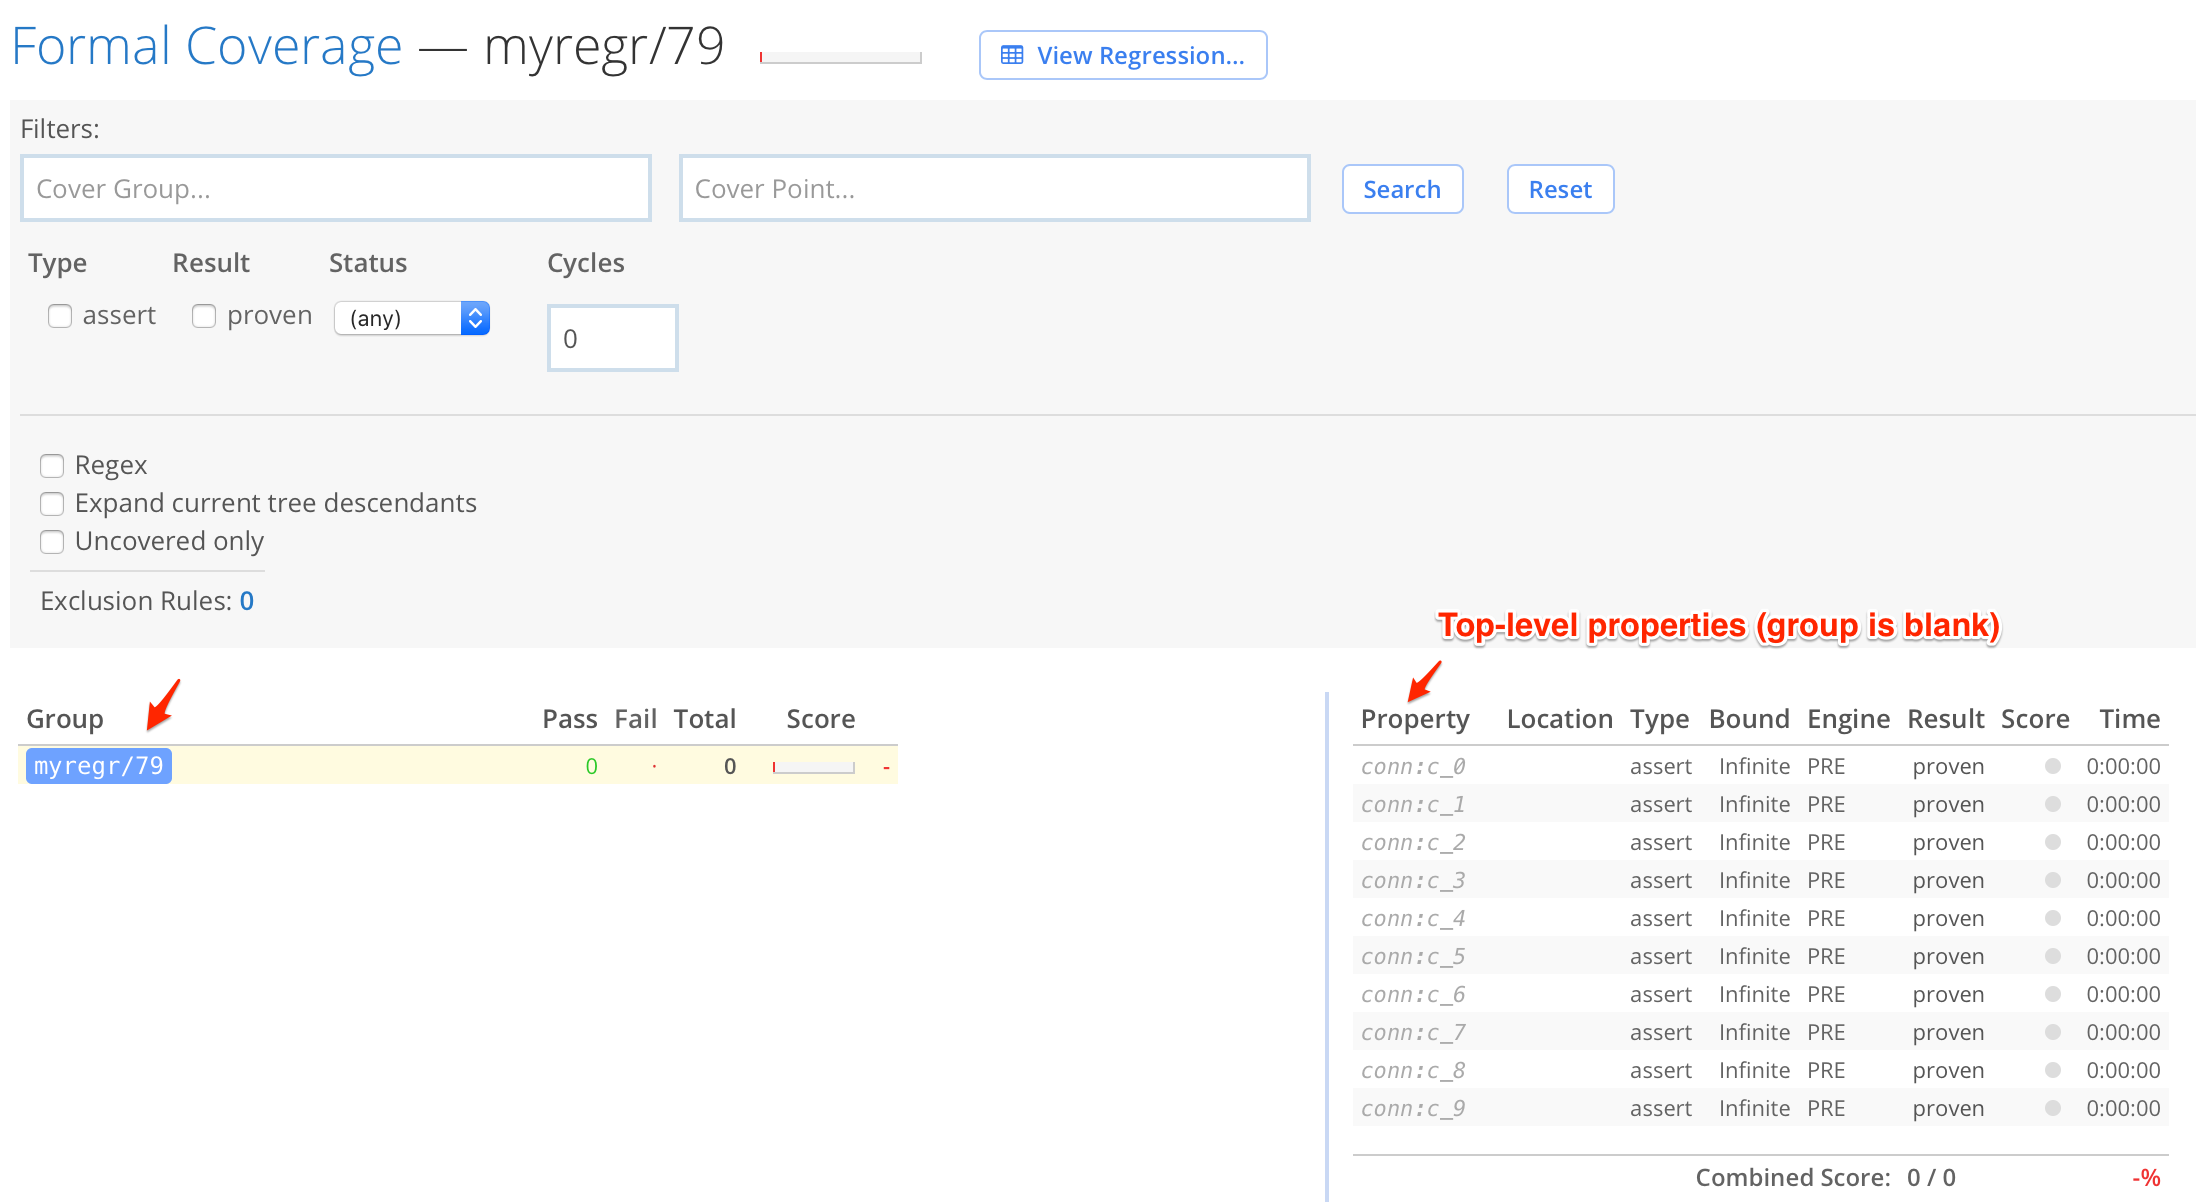
4. bugfix Improved blank coverage groups
Coverage DB's containing coverage points where group is blank
are now stored correctly in the top-level coverage DB hierarchy.
1.443
bugfix Regression search terms within Rules
This release improves Rule search terms to only strip out regression terms if they end in a numeric digit.
For example, the rule:
component =~ alpha, regr =~ daily
Will now be allowed.
However, the rule:
component =~ alpha, regr =~ daily/123
Will have its regr term stripped.
- Otherwise, this rule would be a one-time rule, which only acts on a single regression, and not on future regressions.
1.442
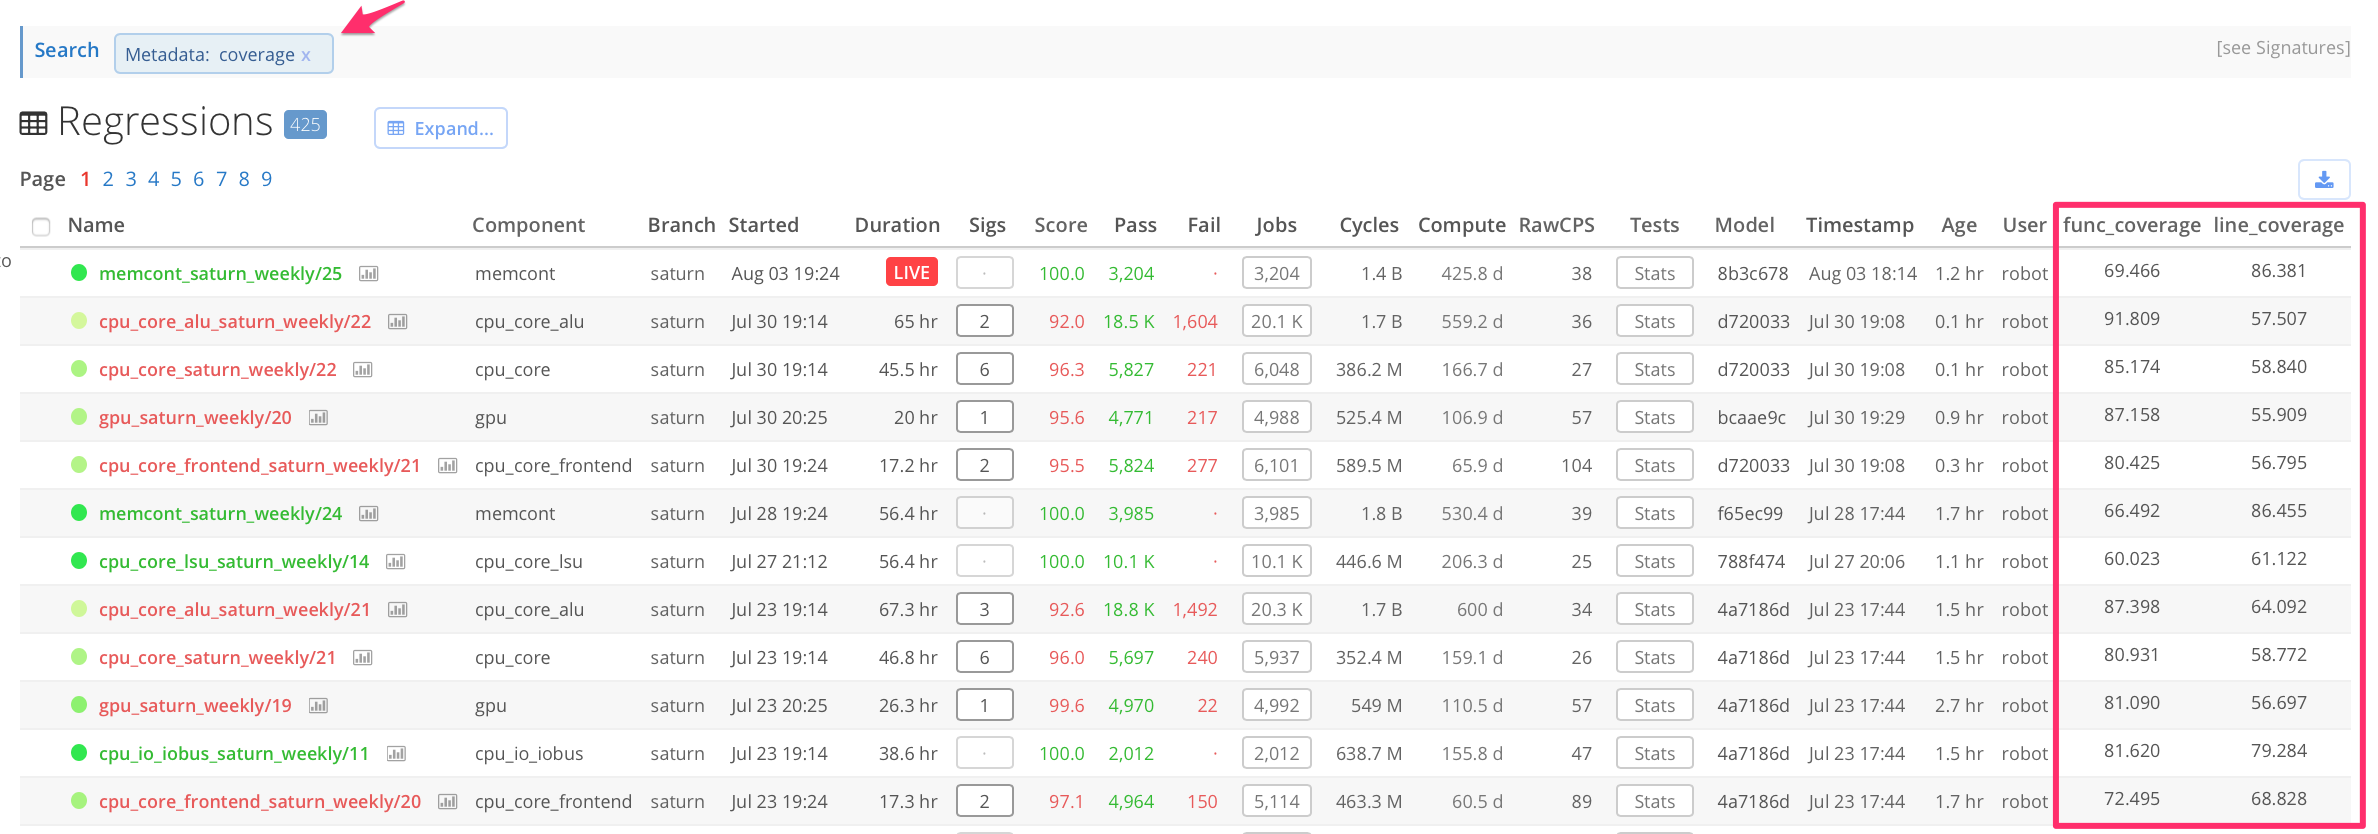
1. feature Regression Search with Metadata columns
If you filter regressions by metadata values, Simscope will now append the column to the search table.
This example shows metadata additional columns matching the regex coverage.
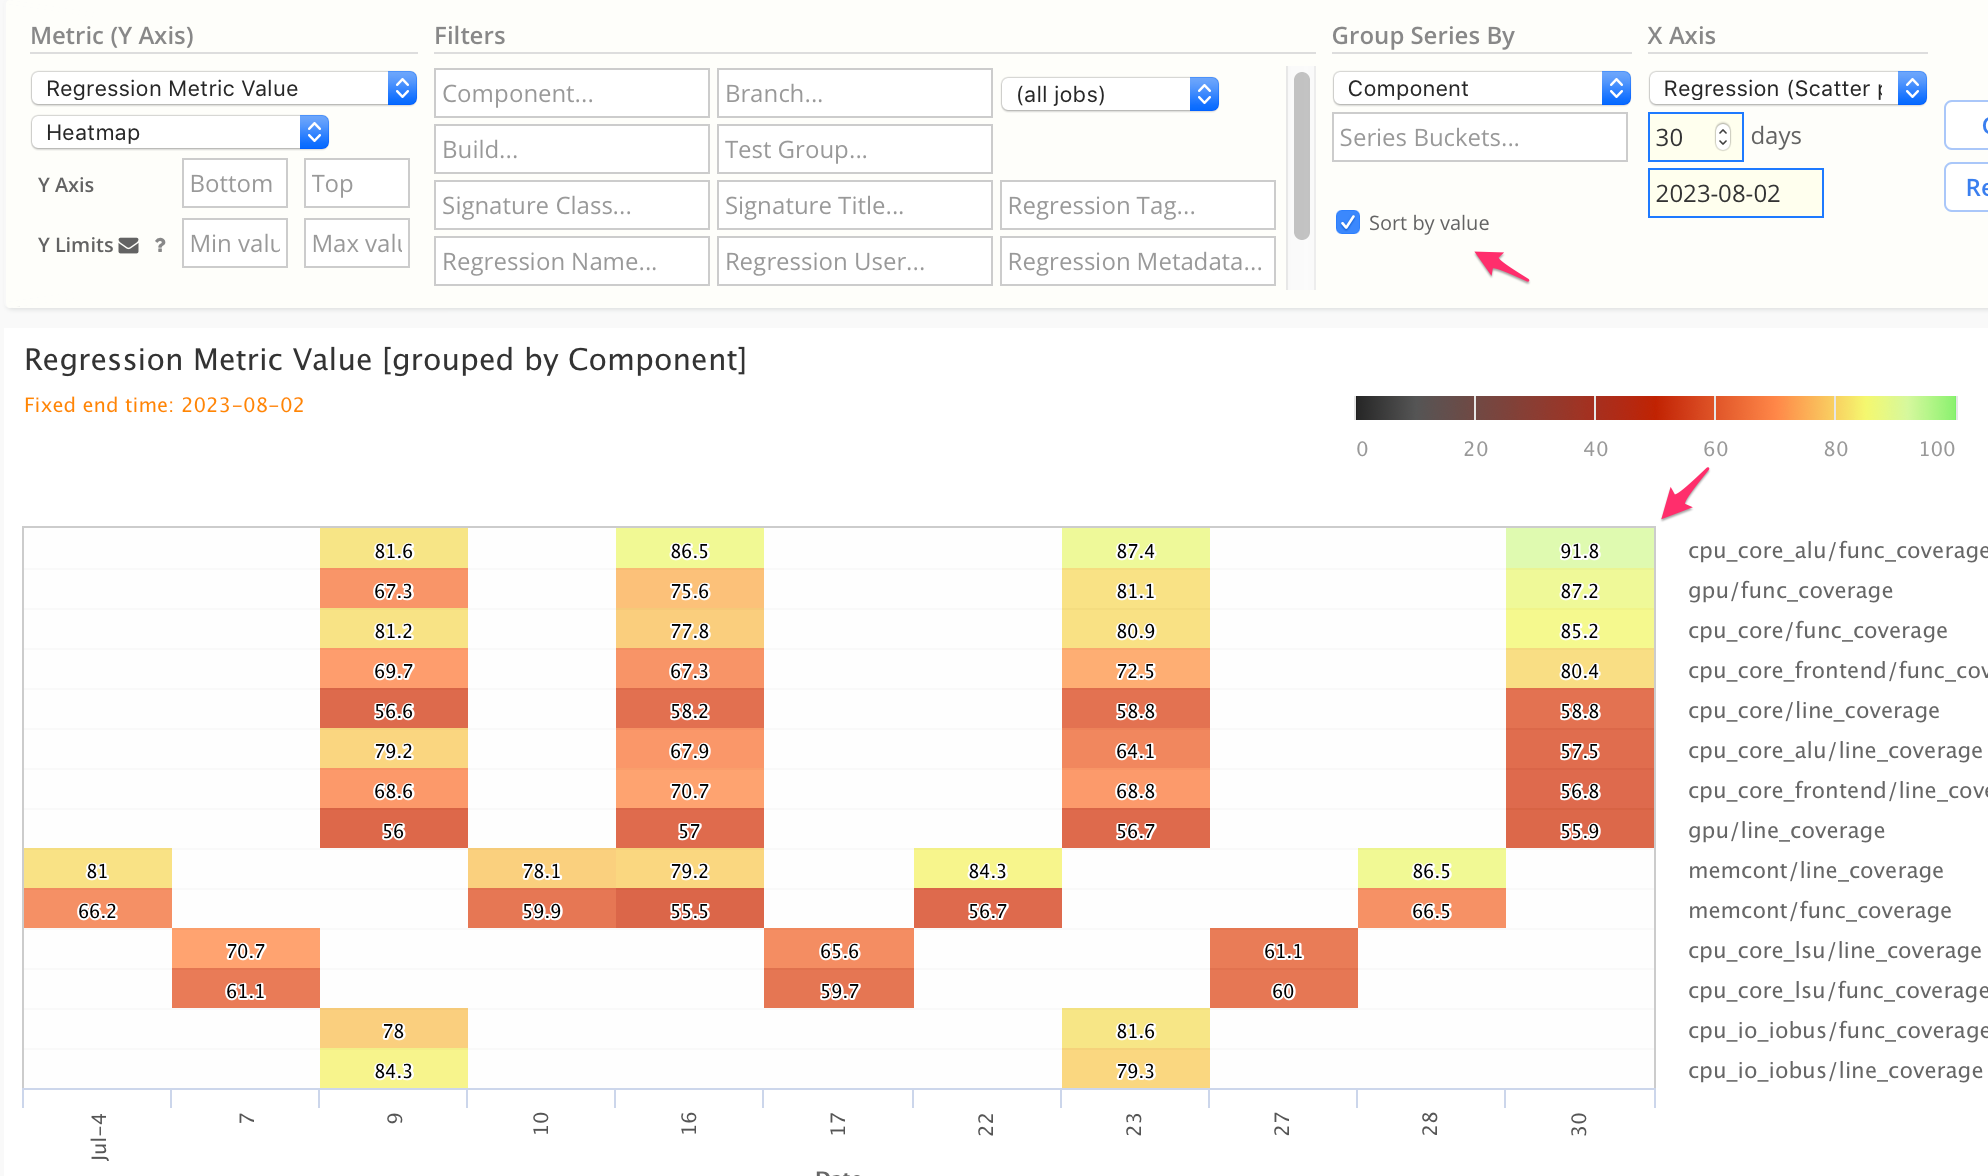
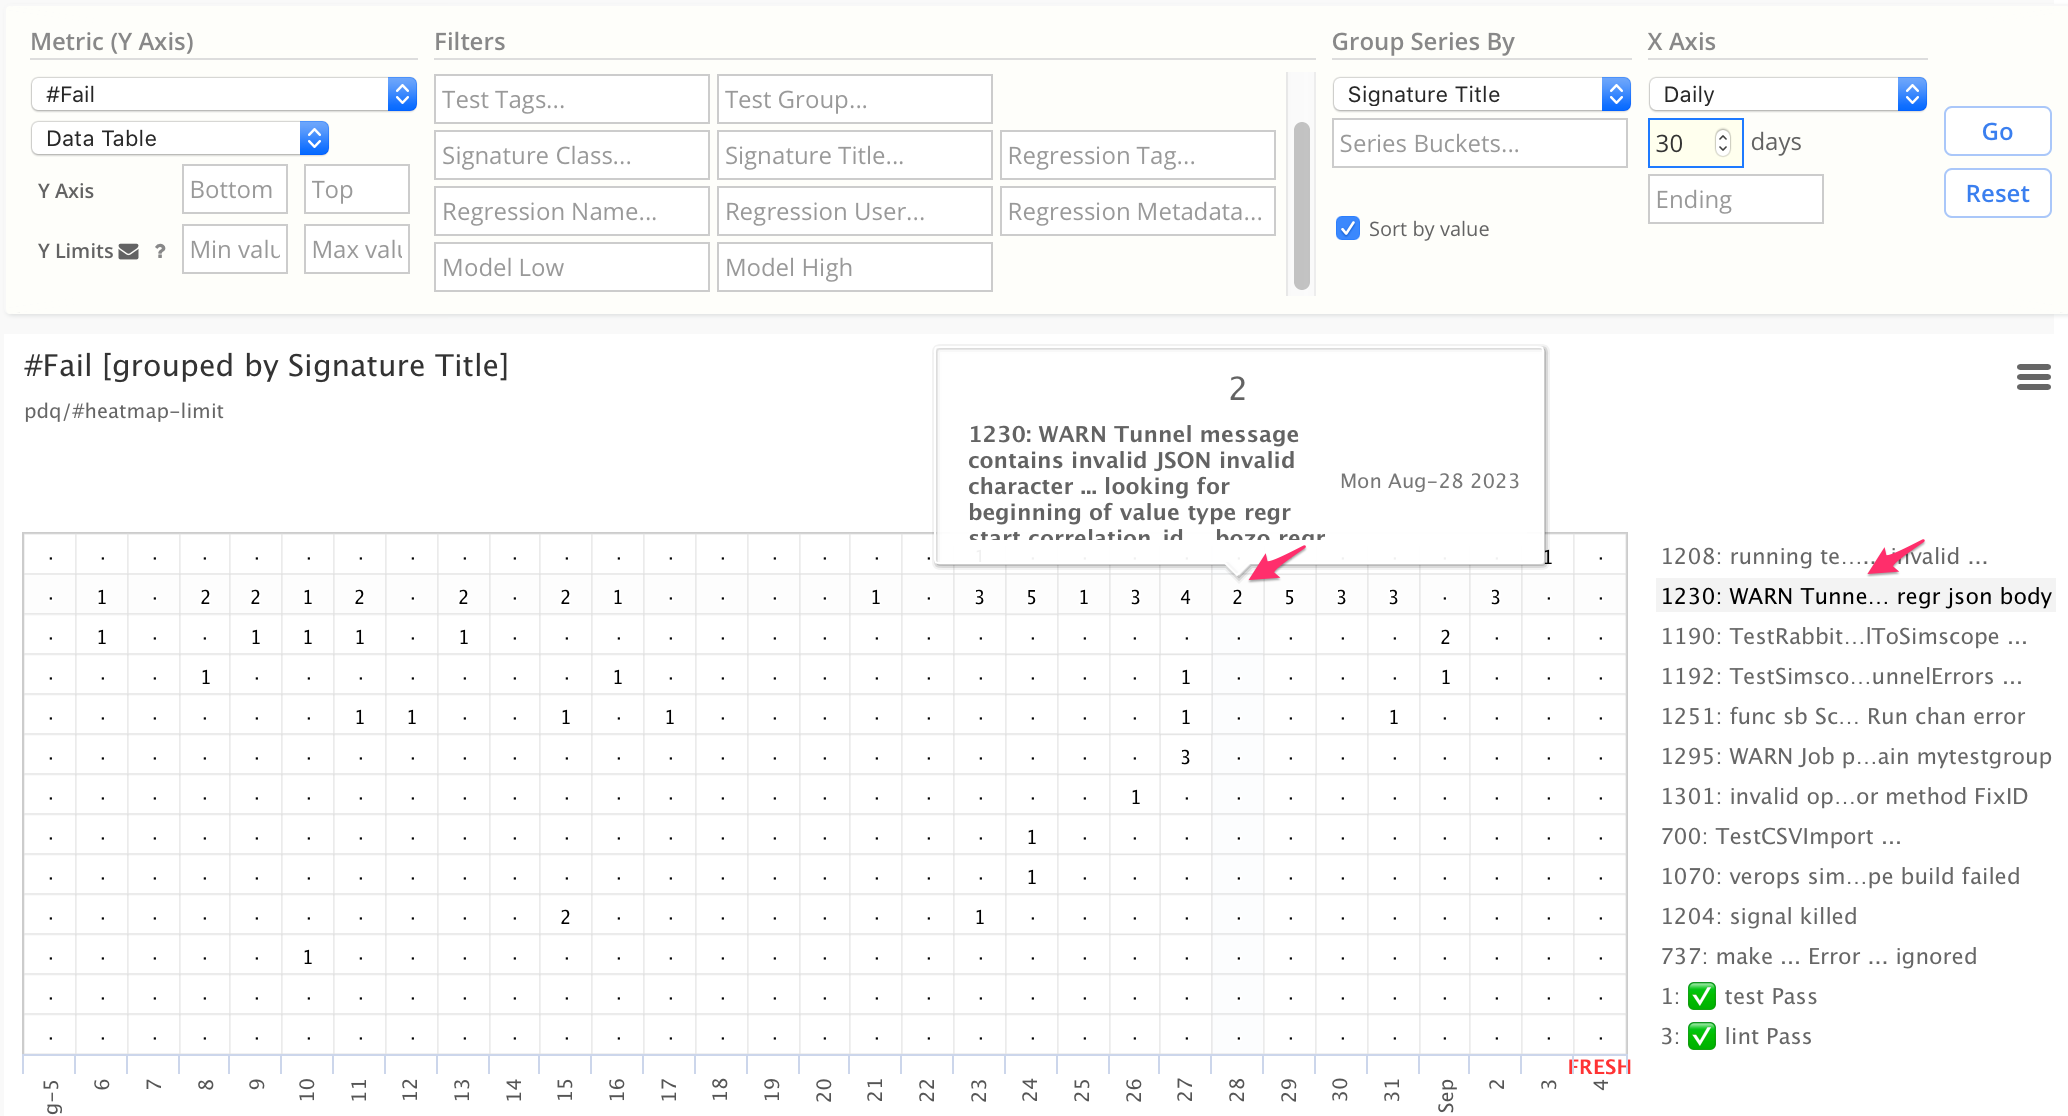
2. feature Chart Series Sorting
Metric Chart Series can optionally be sorted by data value, instead of alphabetically.
Example heatmap, with series sorted by value:
3. feature Chart Series Wildcard
Simscope now supports by a discard and a wildcard expansion via the ! and * series names.
4. feature Added series highlighting for heatmaps
Heatmaps and Data Table Charts now highlight the current series when hovering over data points, to make it easier to browse.
1.441
1. feature Regression Search Table (Builds) column
In the Regression Search Table, Simscope can now optionally show a list of Builds contained in each Regression.
To enable, add this to your simscope.config file:
[regr]
# Turn on a [Builds] column in the regression search table, showing which builds
# are contained in each regression.
tablebuilds = true
2. bugfix Improve LDAP directory authentication errors
SIMSCOPE-66
If LDAP Directory mode is enabled, and user authentication fails, Simscope now shows improved error messages, to indicate if the fail was during LDAP directory bind.
- Previously, it could be ambiguous whether the authentication failed due to LDAP user password or due to LDAP directory password.
3. feature Added Unique Summary row to Regression Text Report
If heatmapsummary is enabled in simscope.config, the
Regression Text Report will now display an additional Unique Summary row at the bottom,
containing:
#Unique#of Unique Pass#of Unique Fail- Unique Pass Rate
4. bugfix Chart runtime bug fixed
In previous Simscope versions, when plotting Runtime charts,
if job runtime == job compute time, Simscope could miscalculate runtime charts as zero
value.
This bug has been fixed.
5. bugfix Show job runtime always
In prior versions, the job details page would hide the runtime field if it were the
same as compute time.
Now it shows both compute and runtime in the job details page always.
1.440
1. feature Signature view: added job search automatic sorting
When searching jobs in the Signature view, these are now sorted in the table by runtime automatically, to show the shortest job matching first.
If you would like to disable this behavior (and sort by most recent job first), add this to your simscope.config:
[sigs]
# To disable automatic job sorting in Signature view, set this to "off"
defaultjobsort = "off"
2. bugfix Drilldown from Signature Saved Search fixed
When drilling down from Signatures Saved Search into Tests, previous Simscope versions would show a saved search not found error message.
→ This bug is now fixed.