Simscope Release History — v320 — 329
1.329
1. feature Beta build/testgroup filtering from Signature search
To enable:
- Add the following to your
simscope.configfile:
[tests]
# Enable signature triage index (build/testgroup search from signatures)
sigtriageindex = true
-
After starting Simscope, click Admin → Table Reindex (bottom of the page).
-
Check Signature Triage Index, and click Reindex button.
NOTE: Reindexing should take up to a half day for the reindex to complete. Check the Simscope terminal to monitor progress.
2. feature Daily server status email
Simscope now sends a daily server status email to the administrator, indicating basic health of Simscope:
- Uptime, version
- License status
- Daily errors
1.328
1. bugfix Runtime column incorrect display in test table
The prior version was incorrectly displaying compute time values in the Tests table.
- This now displays job
runtimevalues instead.
2. feature Sourcecode job field
SIMSCOPE-5
New optional test sourcecode field, if you want to store
testcase source code within Simscope jobs.
→ see Job JSON for more details
1.327
1. feature Separate tracking of job compute time vs job runtime
SIMSCOPE-11
This version now has separate fields for compute time (ie CPU time) and runtime (ie wallclock time).
- NOTE: runtime field is optional. If omitted, the previous Simscope behavior still works, where runtime is equal to compute time.
For example, if simulator license acquisition time for a job took 30 minutes, and CPU simulation time used was only 2 minutes, you would see:
- compute: 2 min
- runtime: 32 min
→ see Job Runtime for more details
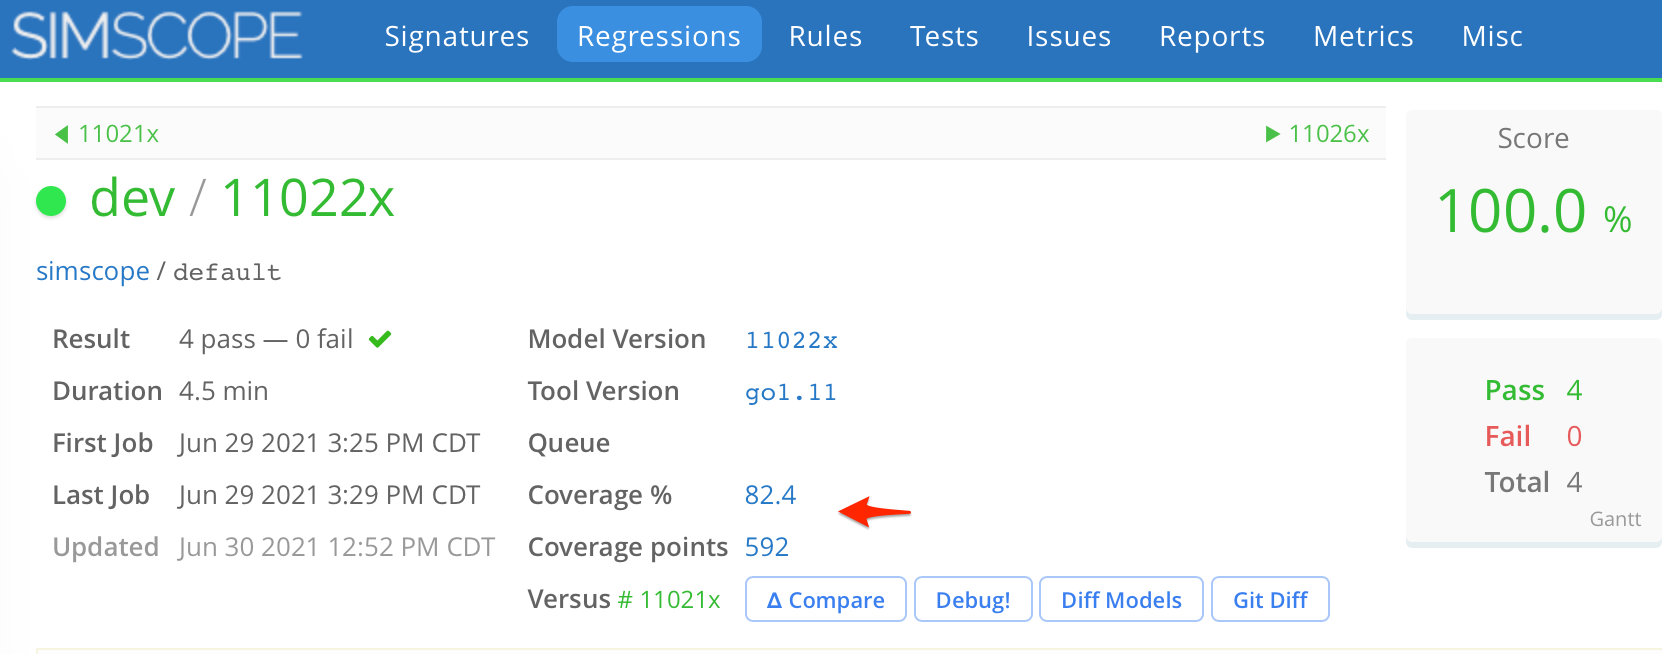
2. feature Filter regressions by coverage DB
Regressions can now be filtered by those which have coverage DB's imported.
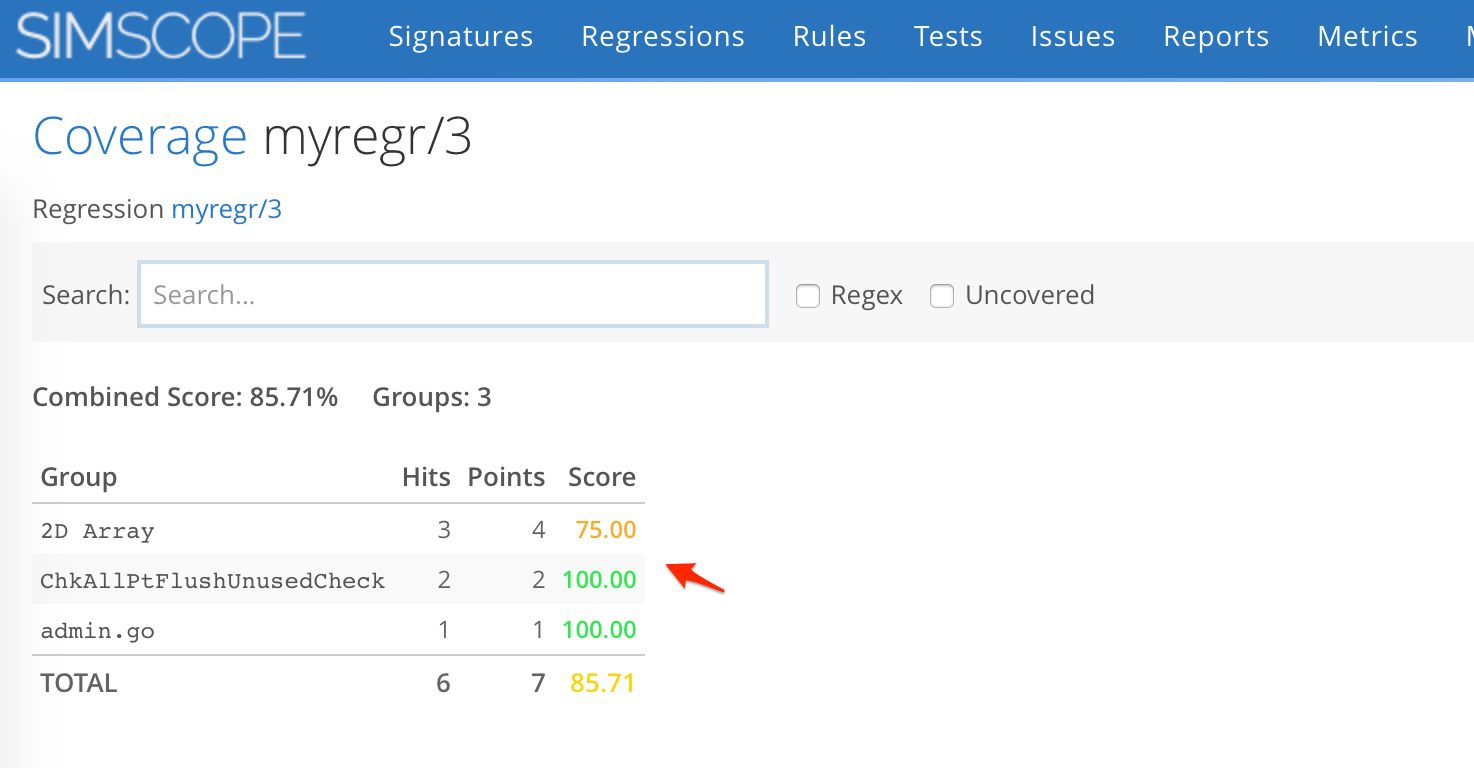
3. feature Configurable coverage DB decimal percentage
By default, coverage DB group percentage now render with 2 digits after the decimal point.
For example, 98.52%
This can be changed for more or less decimals via simscope.config:
[coverage]
enabled = true
# 2 decimals means 98.52%
decimals = 2
Example coverage with 2 decimals:
1.326
1. bugfix Pie chart bugfix
In previous versions, pie charts with 5 or less slices in the pie would display an incorrect chart title. This bug is now fixed.
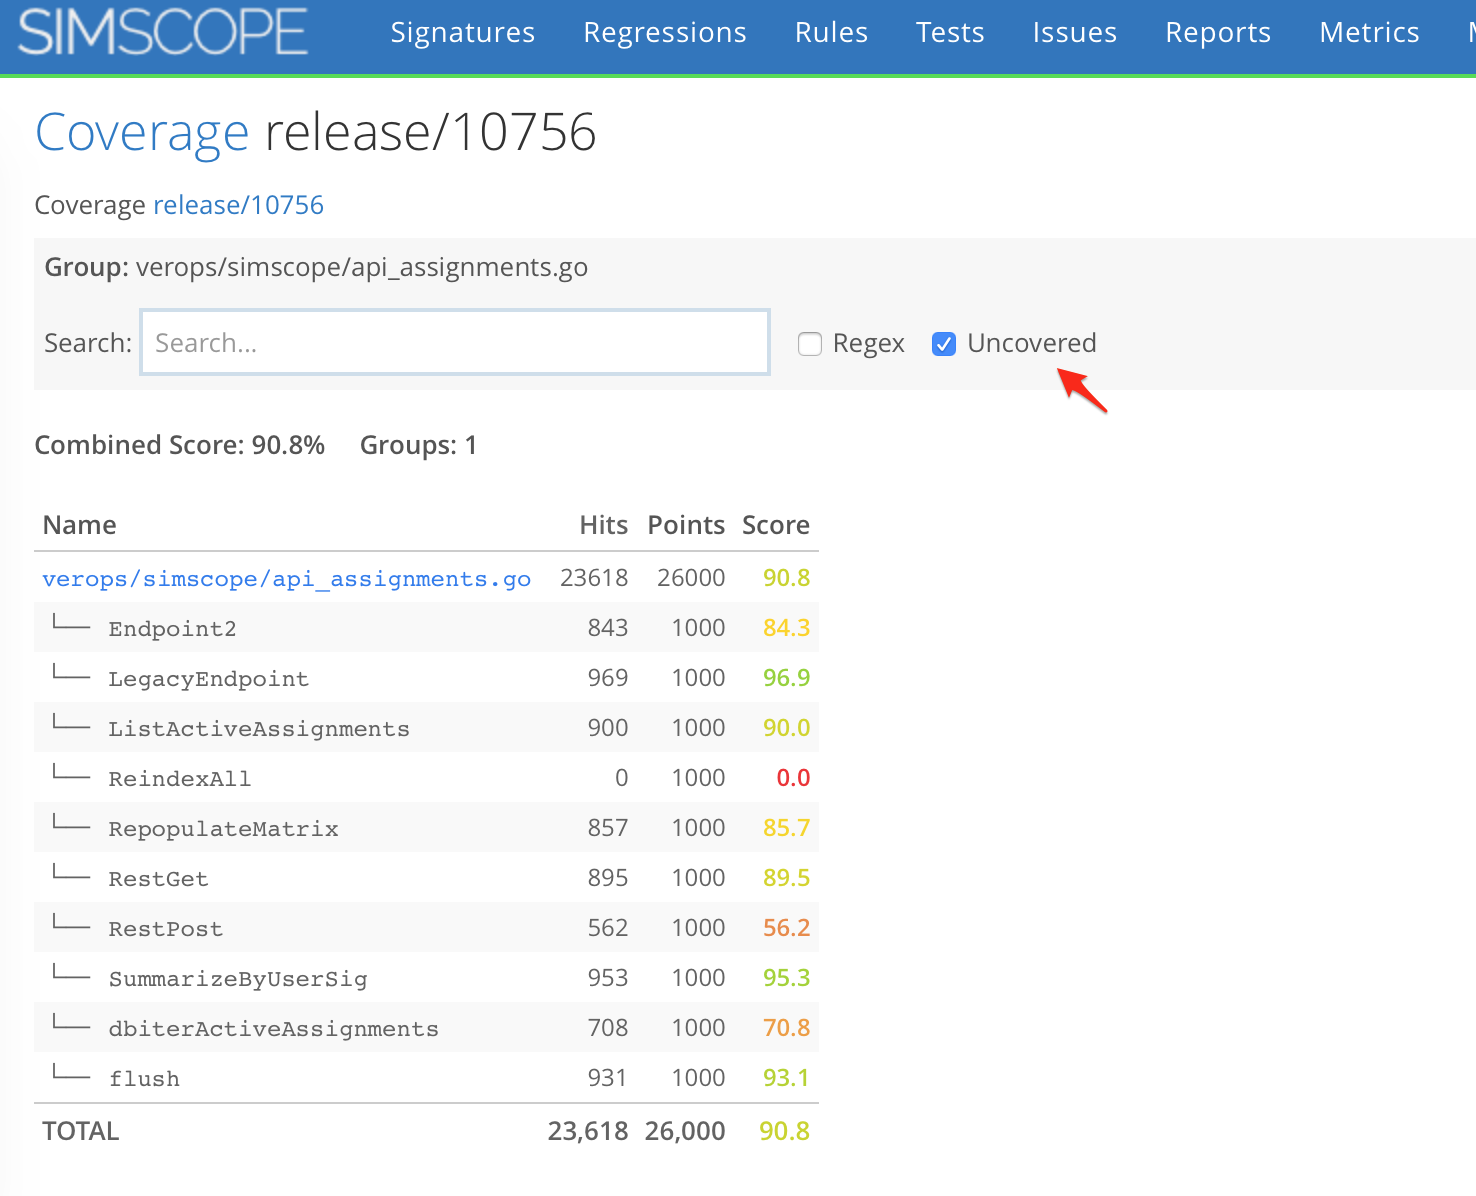
2. feature Cov DB Uncovered filter
For coverage DB, you can now filter by uncovered (aka coverage points/groups that
are less than 100% hit).
3. feature Cov DB Points metric
Coverage databases now store the number of points in the coverage database into the regression.
- This lets users chart number of coverage points over time, as well as coverage % over time.
1.325
1. bugfix Regression Compare Metadata
When comparing two regressions' metadata, the font would wrap incorrectly in previous Simscope version. This bug is now fixed.
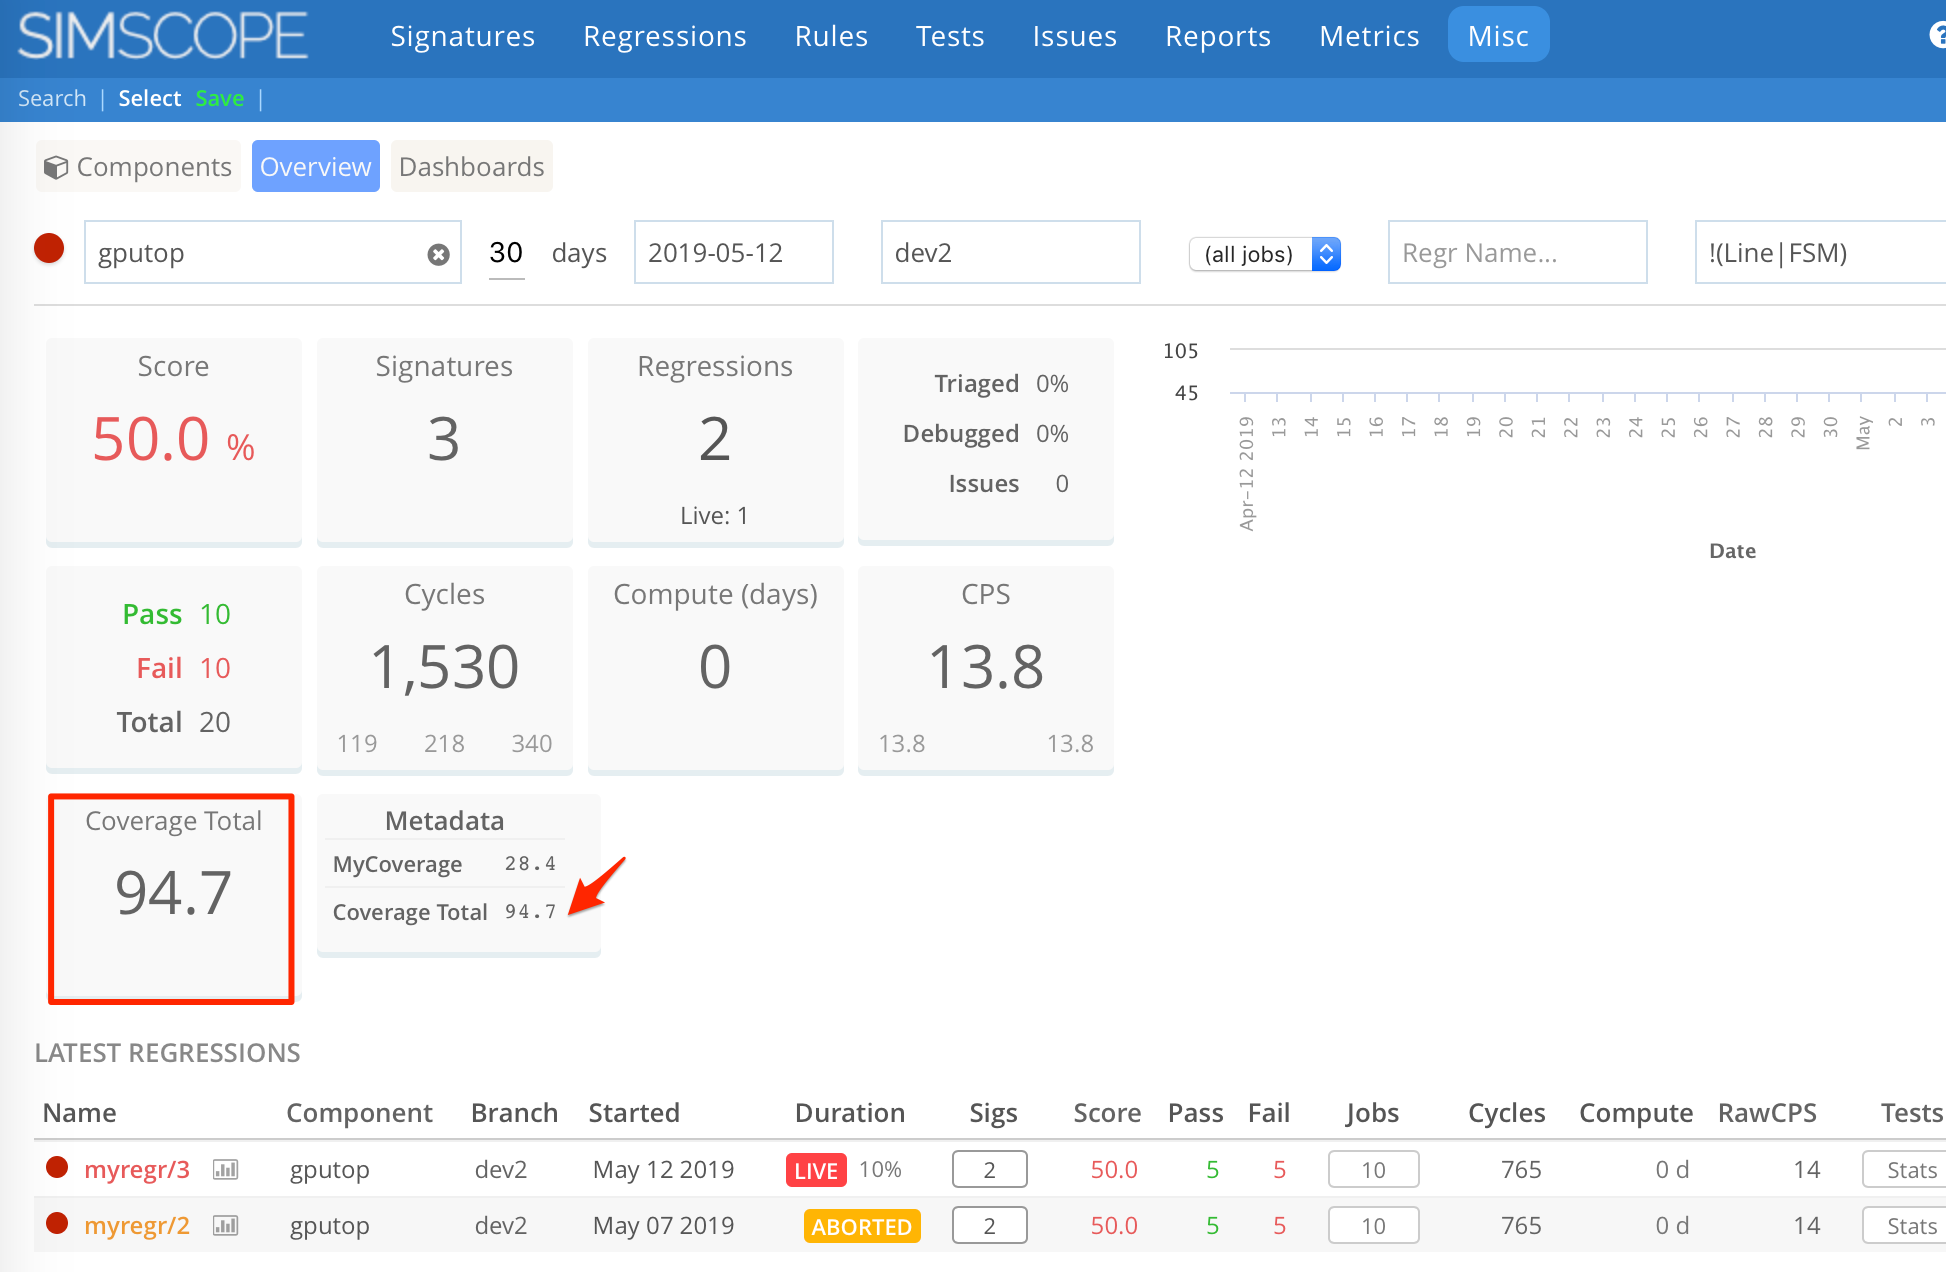
2. feature Component Dashboard Metadata Widget
The component dashboard now has an optional configuration to show specific regression metadata as large numeric widgets.
This example shows the Coverage Total metric promoted to a full-size widget:
To enable, set the dashboardwidgetmetadata field in your
simscope.config file to a regular expression matching
metadata.
This example simscope.config file enables matching total (or capitalized Total)
metadata as widgets:
[chart]
# Component Dashboard Widget
dashboardwidgetmetadata = "total|Total"
1.324
Coverage DB now can perform basic searching of cover points.
1.323
1. bugfix 24:00 timestamp bugfix for Chrome
Added Javascript workaround for Chromium-based browsers, so that midnight-timestamps
(ie 12:00am to 12:59am) show up as 00:30 instead of 24:30.
2. feature Custom Pass/Fail Heatmap Colors
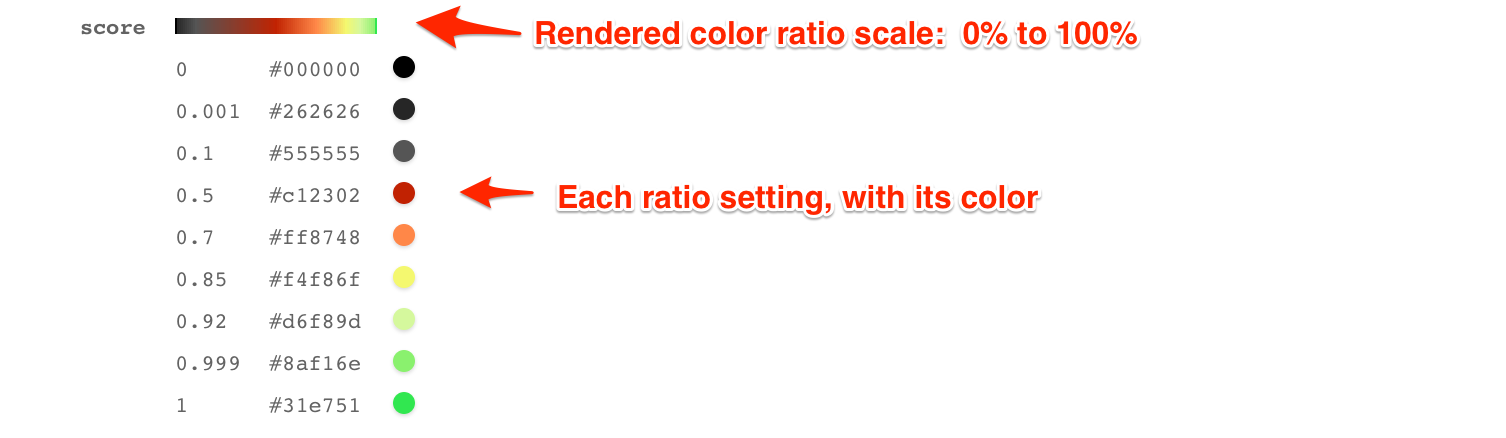
Details:
1.322
1. feature Coverage DB improvements
Simscope Coverage DB now supports:
- Sorting by Name, Points, or Score
- Drilldown from Cover Group to see individual Cover Points
2. bugfix Component Dashboard now ignores LIVE regressions
When displaying the latest coverage results on the Component Dashboard, Simscope will now only show coverage for finished regressions.
1.321
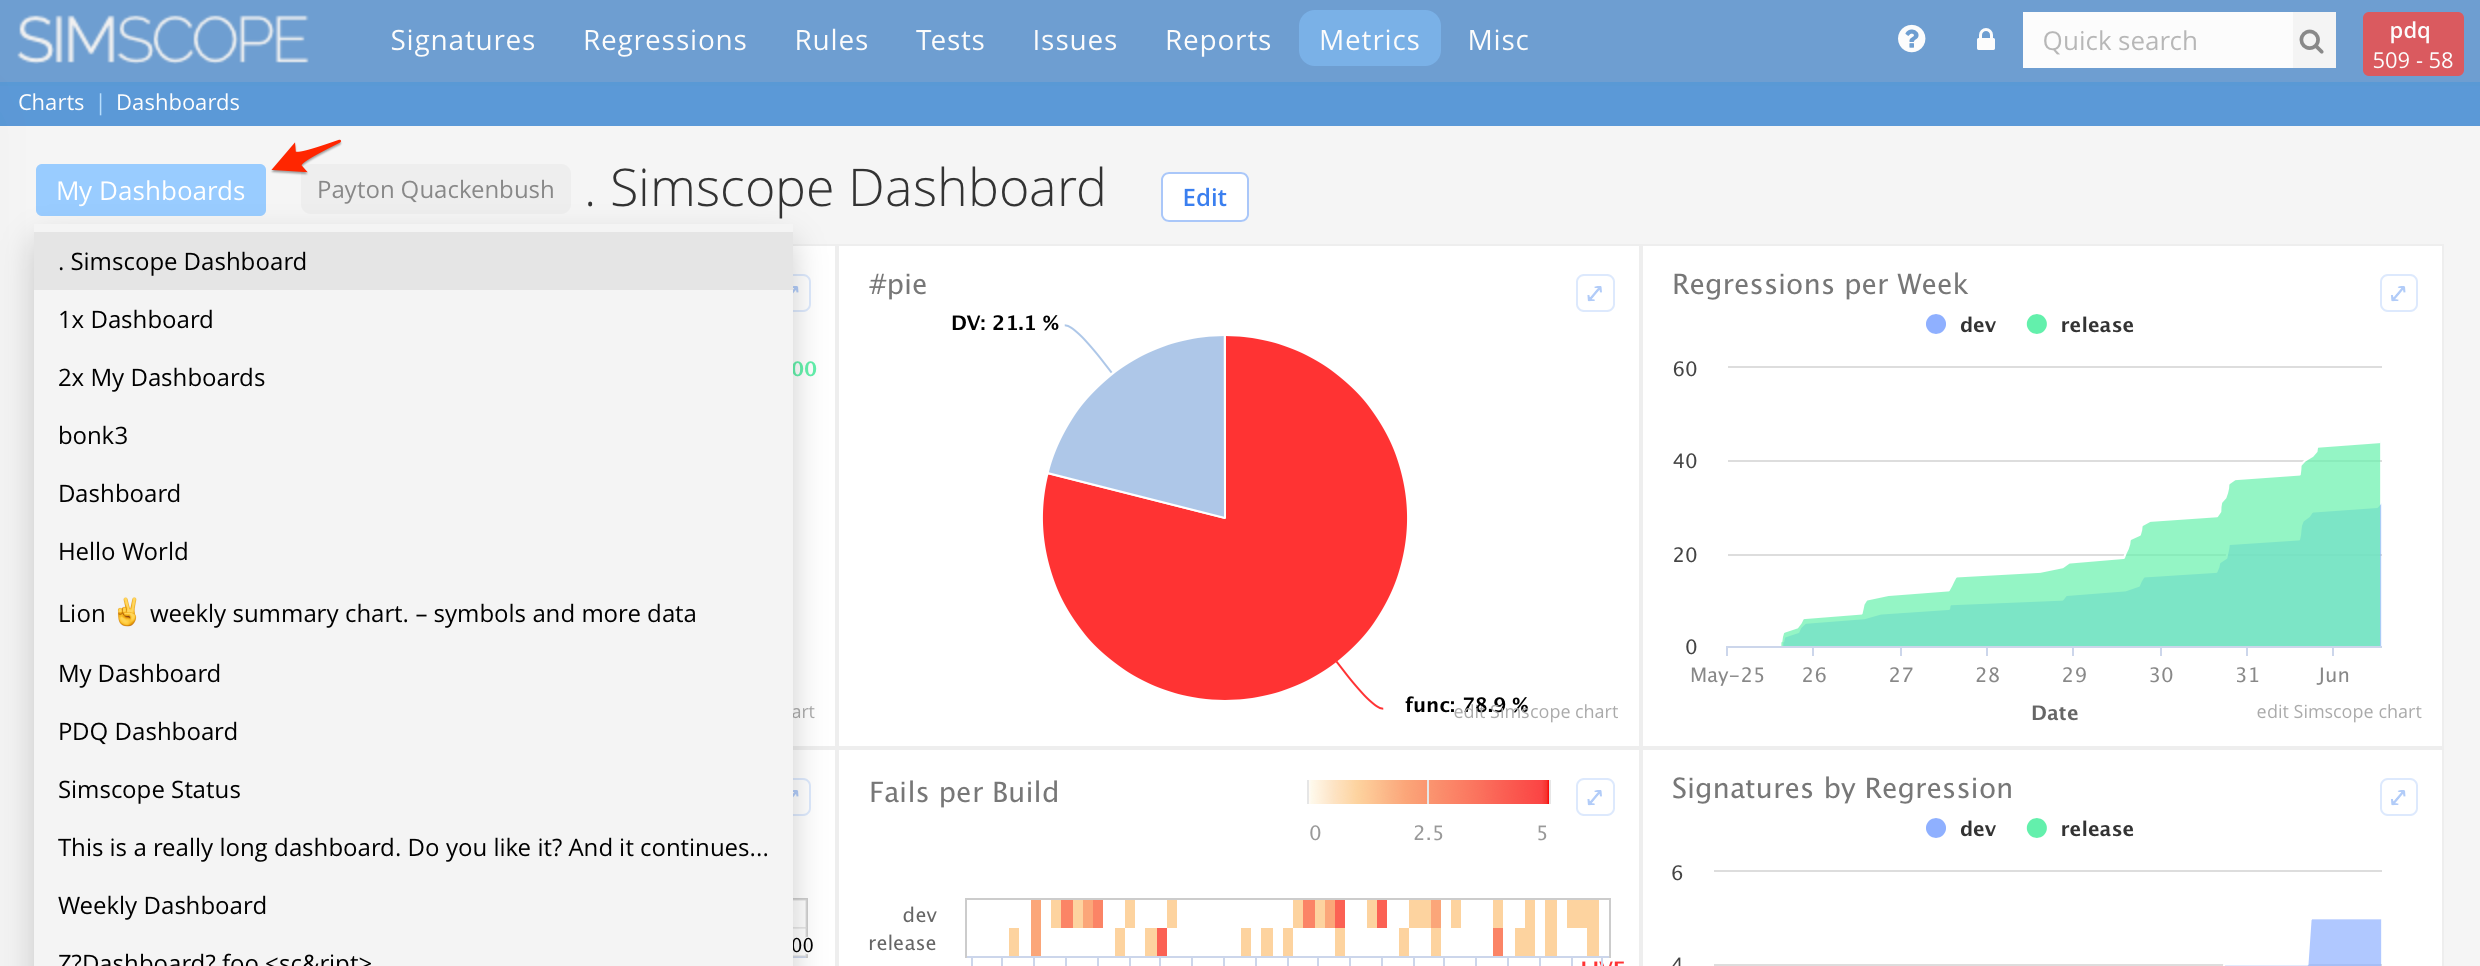
1. feature My Dashboards dropdown chooser
Dashboards now show a dashboard chooser, to quickly switch between a user's dashboards.
2. feature Dashboards support 18 charts
Dashboard limits increased to allow up to 18 charts (ie 6 x 3 grid).
3. feature Coverage flow
First beta of Simscope with coverage groups.
4. feature Increased admin error log
The Simscope admin error log has been increased from 16 kB to 512 kB.