Simscope Release History
How to upgrade?
Note: to upgrade your Simscope or Tunnel version, please follow the Upgrade instructions.
→ See also Tunnel Release History
1.543
1. feature Improved out-of-disk detection
Added improved out-of-disk space detection, for groups which have stored on NFS (network filesystems).
In this case, Simscope can get stuck if a filesystem runs out of space, and the process needs to be restarted to recover.
2. bugfix Improved secondary charts
Fixes for secondary charts:
- If no charts are saved, the secondary chart dropdown will be hidden.
- Added chart subtitle for secondary chart, to indicate details.
3. feature Changed log stream
Admin: changed the default logstream target to simscope.log
1.542
1. feature Improved LIVE job error messages to show cause
When live jobs are killed by Simscope, it now bucketizes them into easier to understand messages, which shows the cause (e.g. manual kill, timeout, or lost job).
For example:
Missing LIVE Job:
Regression finish received without Live Job finish
2. bugfix Reduced LIVE job timeout runtime
In previous versions, LIVE job timeouts would show up with a maximum runtime of 24 hours,
which can skew regression statistics.
- This has been reduced to
30 minutes.
3. bugfix Fixed Chart Rename
When renaming Charts, any dashboard containing the original chart will be updated with the new chart name.
Previously, any dashboard containing a renamed chart would be broken.
4. feature Added RabbitMQ queue debug
Admin area now shows the outstanding RabbitMQ queue size.
5. feature Added RabbitMQ pause and resume
Administrators can now pause and resume RabbitMQ activity.
6. bugfix Fixed JIRA assignee matching bug
Added a workaround for JIRA, where multiple assignees with similar email addresses were matching incorrectly matching when opening a bug from Simscope (fuzzy matching).
For example, foo.bar@company.com could also incorrectly match a similar email
foo.a.bar@company.com
Now the list of users returned by JIRA are filtered for the specific email.
7. feature Improved regression email subjects
Simscope regression emails now show pass/fail as the first word in the email subject, to make status obvious.
Failed: dev/21667x — 0% (50% total) — 1 signatures [Last 7 Days] Simscope Regression Watch
1.541
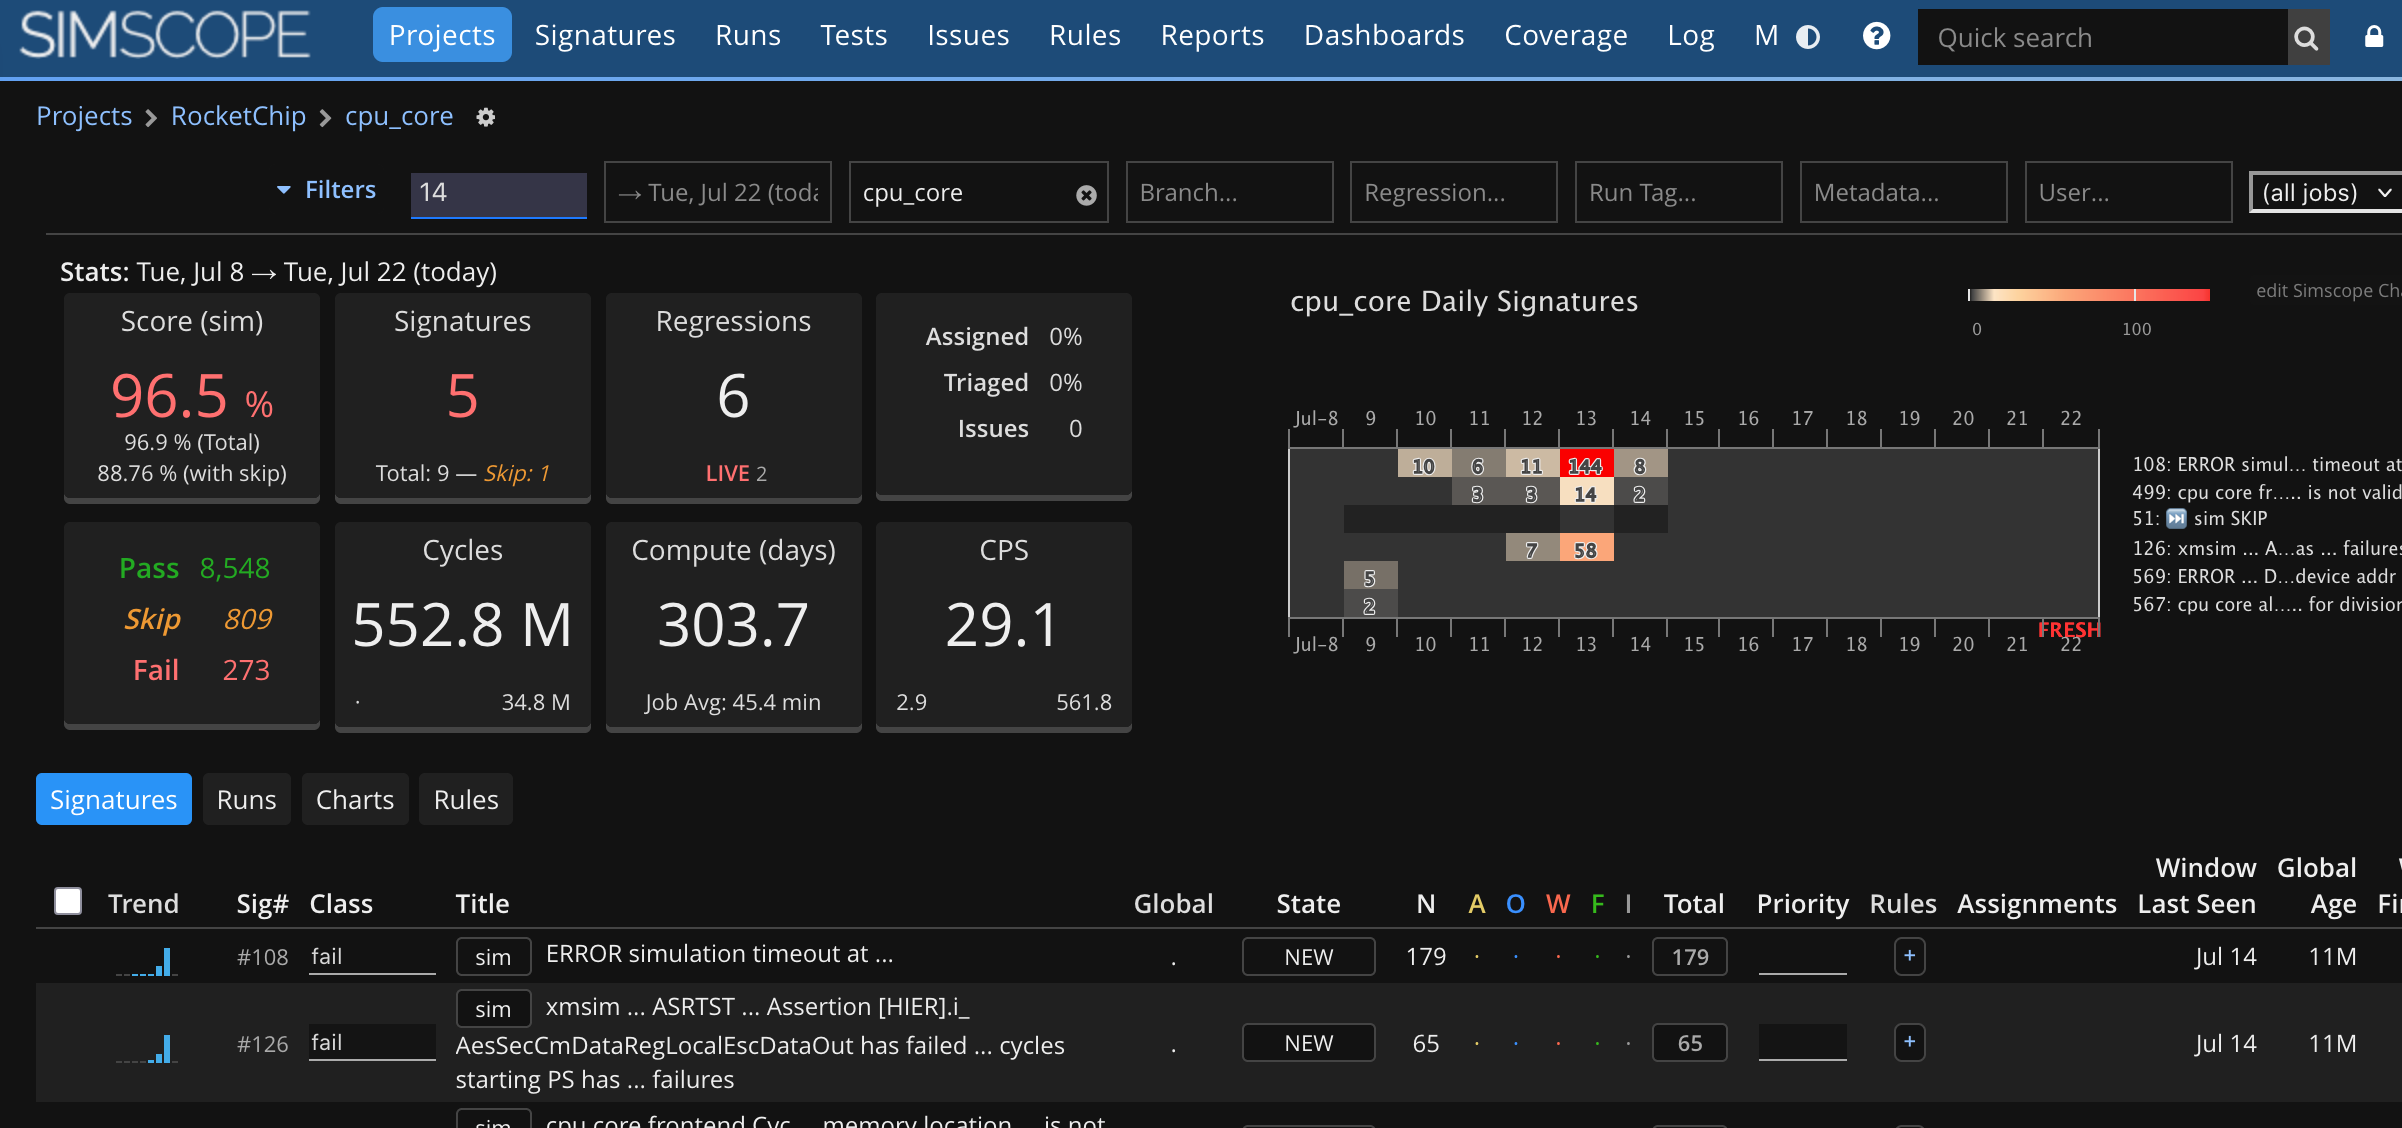
1. feature Project Drilldown
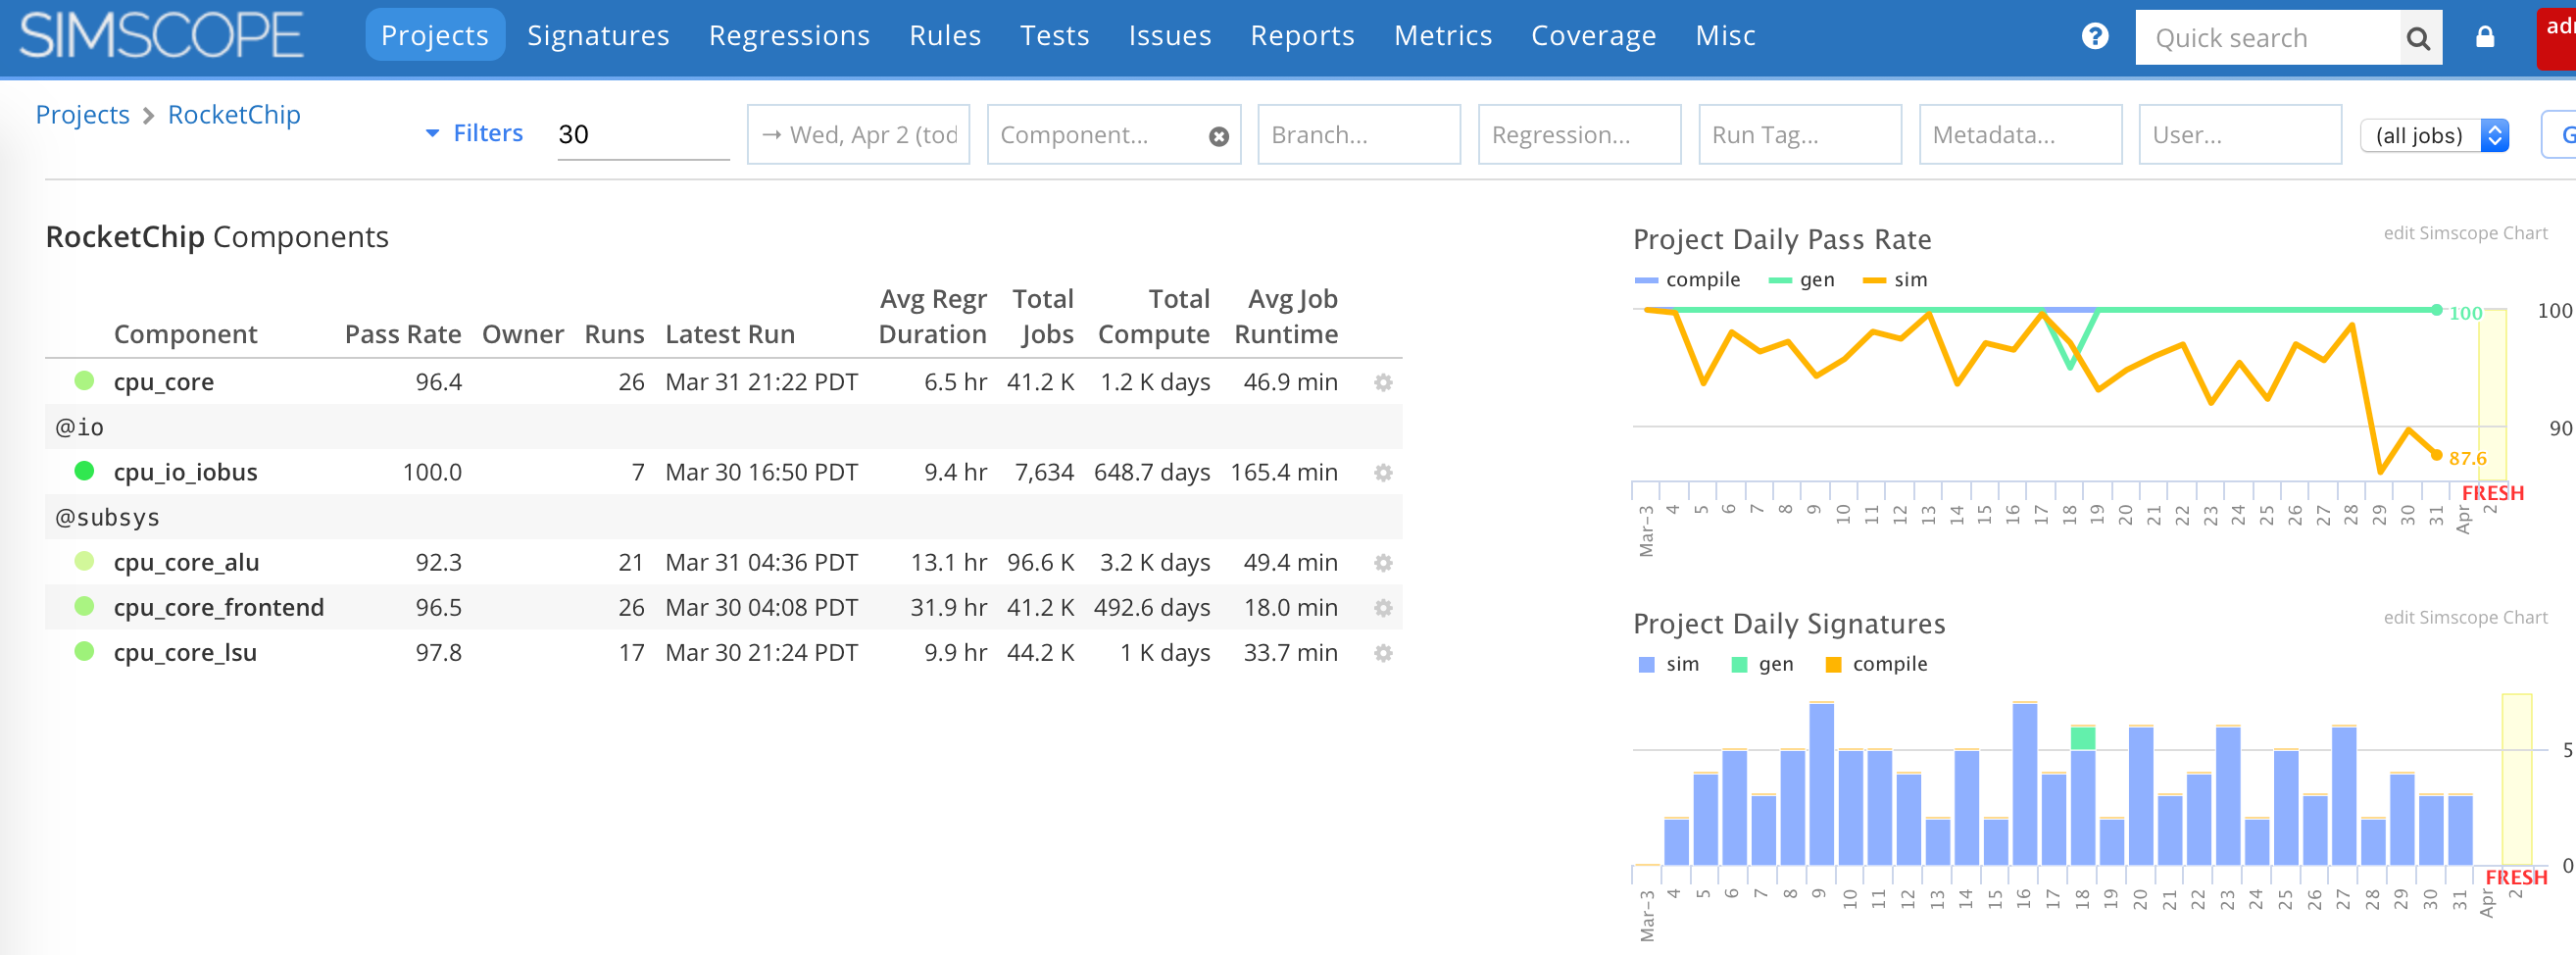
The Project section renders in a tree format, to enable drilldown from:
- Project → Subproject → Component
2. feature Added Regression Watch Fail Only
Added a regression watch schedule for fail only.
3. feature RabbitMQ daily auto reconnect
Added daily automatic disconnect/reconnect for RabbitMQ.
There have been cases where connections get randomly stuck, so this may alleviate that behavior.
This also includes a manual reconnect button for administrators.
1.540
feature Added force unlock
Danger: added --danger-force-unlock option.
- This command allows force unlocking of the DB locks, in case of hardware crash.
- Not recommended for any production use.
1.539
1. feature Improved duplicate Job Algorithm
Improved the duplicate job detection algorithm, to reduce likeliness of duplication by a large amount.
Also added improved debug info when duplicates are hit.
2. feature Rule Template Migration
Added support for bulk migration of Rule Templates, allowing change of component and/or assignee.
- For example, change a batch of rules form Assignee X to Assignee Y.
- This also migrates child rules with the same change.
3. feature Login Banner Message
Simscope now has a configuration to enable a Login banner message, via the simscope.config file.
For example:
[server]
# Login banner message.  Use \n for newlines.
loginbannermessage = "Welcome to Simscope!  This is a banner message.\n\nPlease contact ABC for support."
4. feature Added Regression Details hiding
Simscope now has a configuration to hide regression details by default, via the simscope.config file.
To enable:
[regr]
# Automatically hide regression details by default (user clicks toggle to un-hide)
autohidedetails = true
5. bugfix Bug create JSON missing job metadata
In previous releases when creating bugs, the output
JSON was missing the job metadata array.
This is now fixed.
1.538
1. feature Combo charts (secondary charts)
For example, Pass Rate + # Jobs in a single chart.
Limitations:
- Only works for line, bar, and area charts (not heatmap or pie charts).
2. feature Changed Default Project Route to Signatures
When drilling into a project.
3. feature Changes Default Runs to drilldown by Component
The Regressions (e.g. Runs) endpoint now automatically groups results by component, instead of providing a flat list.
Users can drilldown within the component to see a list.
4. bugfix Another testplan fix
Fixed testplan feature disable bug.
1.537
bugfix Ignore HUP signal
Simscope now ignores SIGHUP signal, to prevent accidentally OS accidental killing of the
process.
feature Run details toggle
Simplified view, toggle for details
1.536
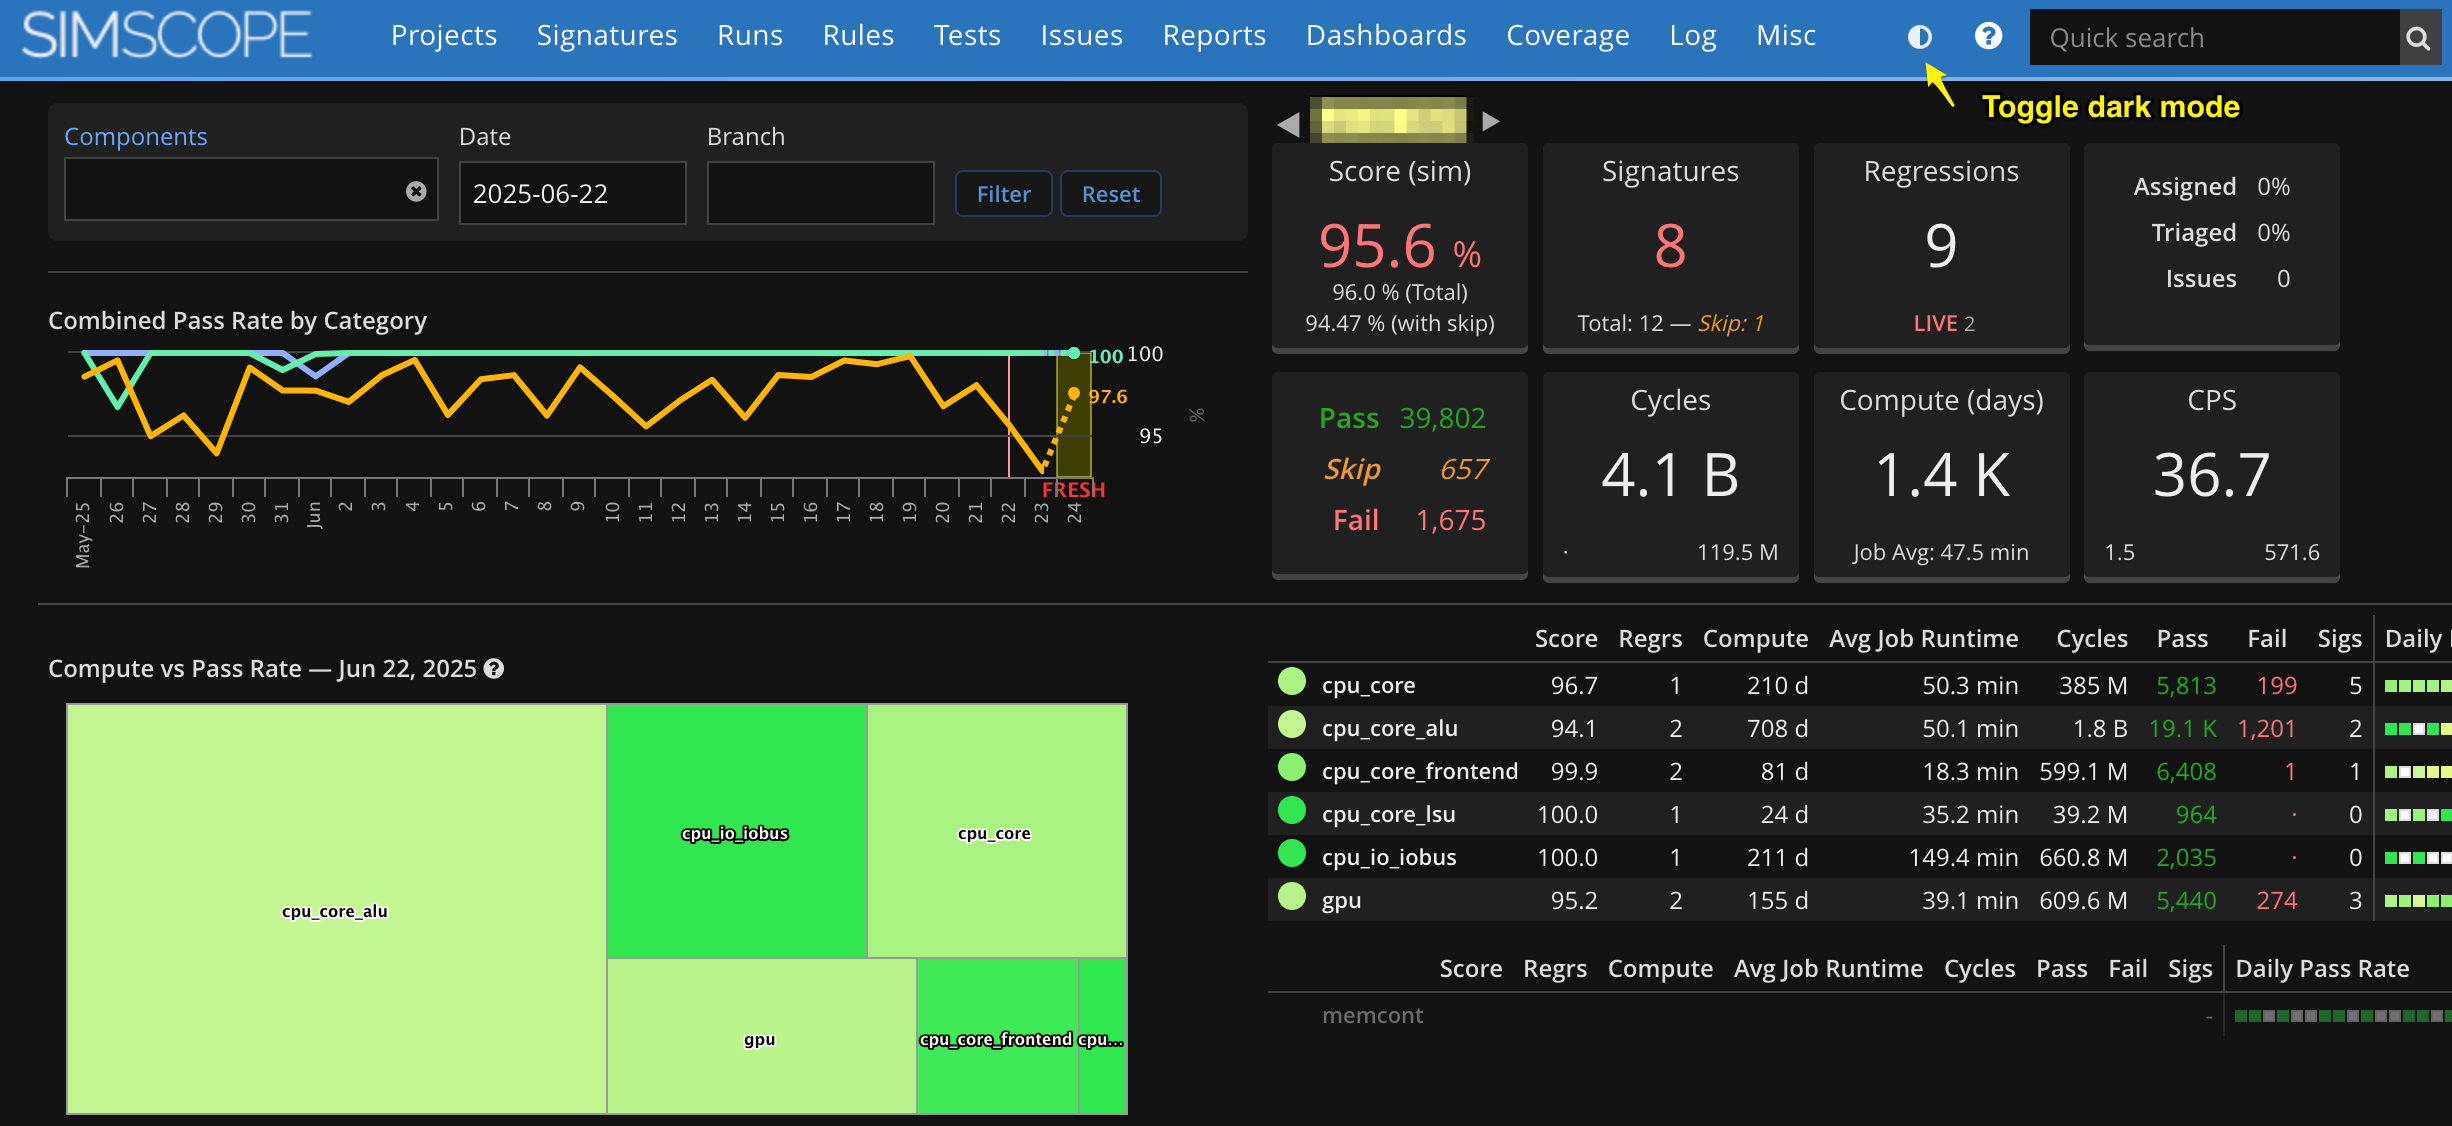
1. feature Dark Mode Theme
Simscope now has a Dark mode, for users who have enabled in the browser/operating system, or users who prefer rendering in dark (inverse) colors.
- Dark/Light mode can be toggled manually via the icon in the top-right corner.
Component:
2. bugfix Fixed signature bucketing bug with assertions
Some UVM assertion errors were begin over-collapsed. This has now been fixed so that each assertion name will be a separate signature.
[sigs]

# Latest signature bucketizer, with customizable hierarchy
bucketizer = "v2"
3. bugfix Run Back/Next link filters with same component
The Previous/Next links when navigating regressions now follow the current component.
4. bugfix Event log heartbeat
The event log now has a heartbeat, to keep connections open even if no activity.
5. feature Renamed Metrics to Dashboards
To make it clearer, the header now is called Dashboards.
1.535
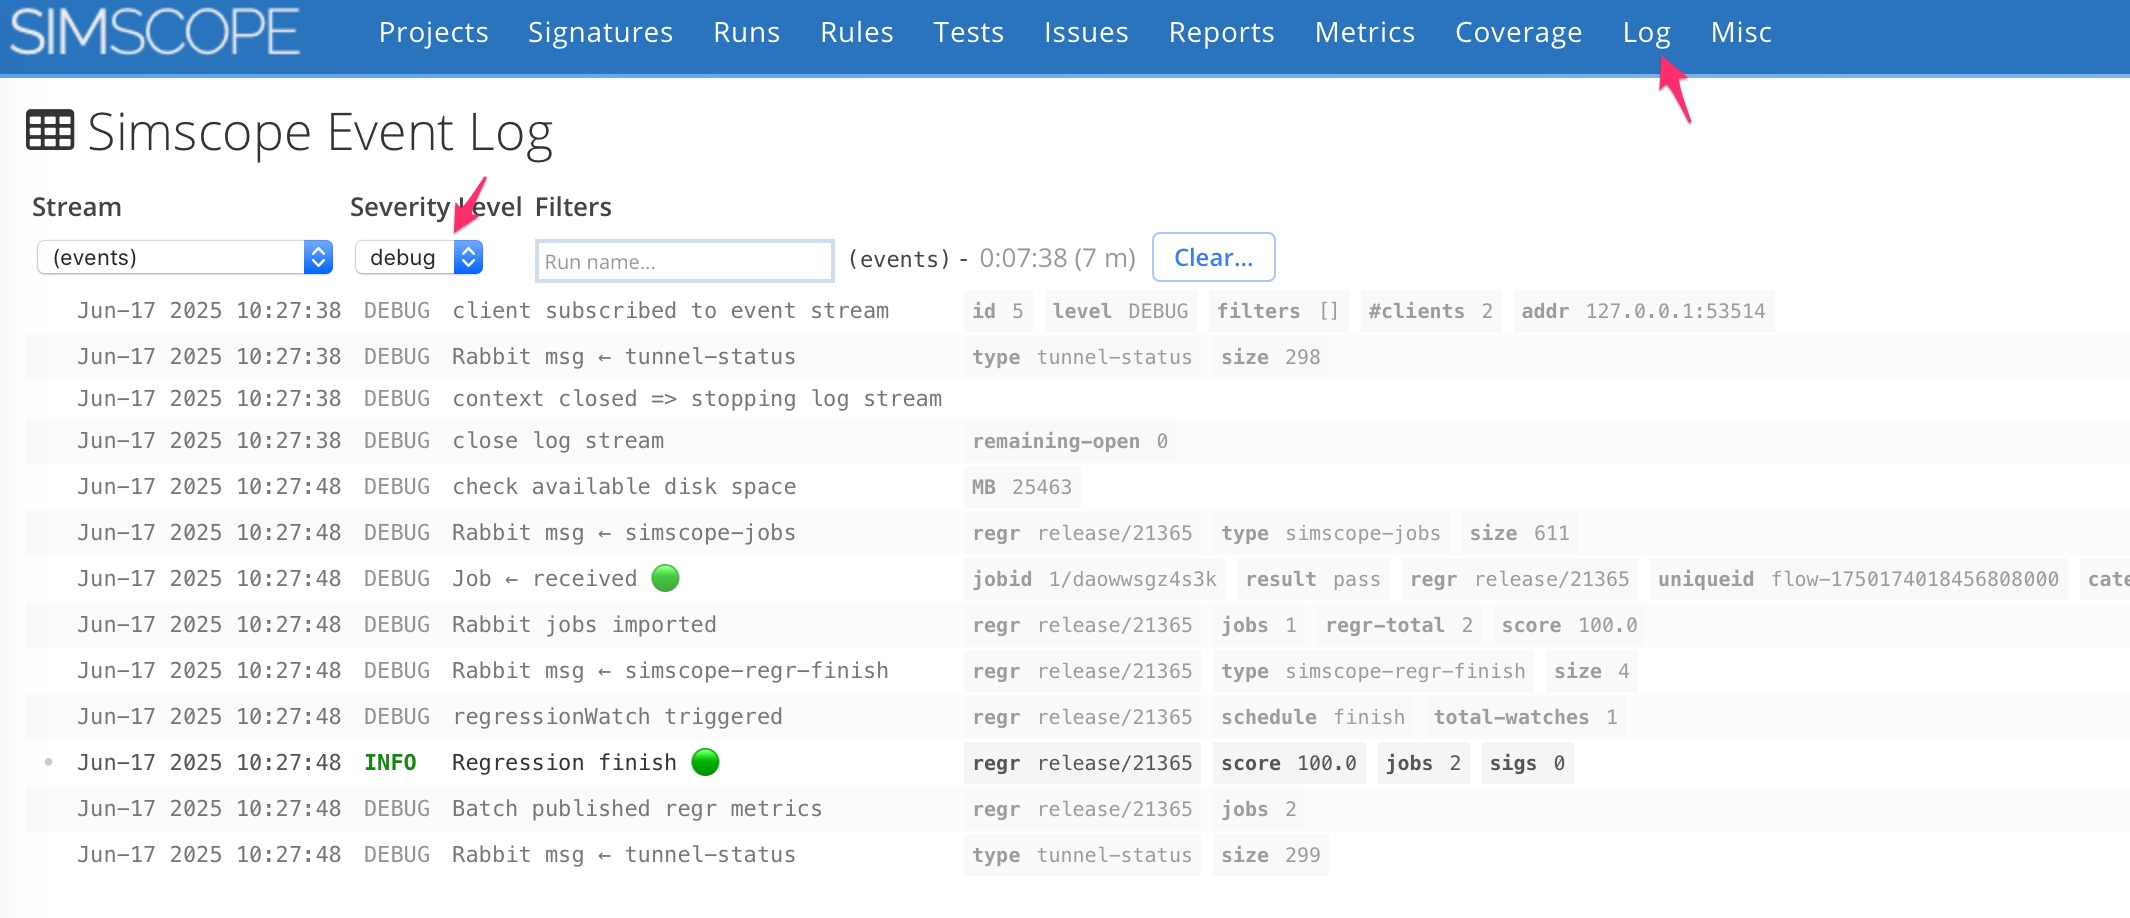
1. feature Event Log
For administrators, there is now a live Event Log, which allows watching and debugging log events dynamically from the browser.
This allows improved debugging of JSON job and regression messages, and allows simpler
watching of warnings and errors.
For example, you can watch for a regression release/124, and only those events will be
shown.
2. feature Changed Project view to 7 days
The default Project view now shows 7 days, instead of 30.
3. bugfix Run tag drilldown fixed
When clicking on Run Tags, this now filters based on:
- Current filters.
- Plus the new run tag clicked.
Previously, this would apply the run tag, but remove all other filters.
4. feature Added Priority field for Coverage
Coverage now allows a priority field. This is used in the testplan parsing template.
5. bugfix Empty heatmap fixed
Heatmap charts with empty (null) data now render as blank charts, instead of showing a
no data metched error message.
1.534
feature Testplan/Coverage updates
Various bug fixes for the Testplan flow:
- Added Balanced score mode, where each coverage group is averaged with the same weight.
- Fixed a testplan parse bug where
Featurewas rendering as blank. simscope-gsheets-testplan.py: added--runtagoption, to allow filtering regressions by Run Tag
1.533
1. feature New Simscope Logging
Simscope now automatically runs with a file-based message logging file called simscope.log,
stored into the DB directory.
Also, by default, console-level (e.g. stdout) logging has been reduced to show warnings and
errors only.
There is also a web-based log watching algorithm too.
For more verbosity, you can enable enable DEBUG level logging, by setting the environment variable:
$VEROPS_LOG_LEVEL=debug
2. feature Improvements to Testplan parser
The Testplan Parser now supports:
- Hierarchical
Feature/SubFeature - Gating depending on the
PriorityandStatusfields
3. bugfix u64 job metadata fixed
There were several comparison bugs in hex (ie uint64) job metadata that have been fixed,
including bit slicing operations (e.g. my_var[63:61] == 0x2).
4. bugfix Fixed wide source code bug
The job details page now wraps better when rendering long (wide) source_code fields.
5. bugfix Increased dashboard chart limit
Metric dashboards have been increased to allow up to 36 charts (previously 18).
1.532
bugfix Job config field wrapping
Fixed SIMSCOPE-155: job config field was overflowing incorrectly.
bugfix Gantt chart click
Users can now click anywhere on the gantt chart to drill into job details.
1.531
1. bugfix Increase Gantt chart limit to 5000 jobs
The Regression Gantt page has been increased to render up to 5000 jobs on a single chart.
2. bugfix Gantt bar hyperlinks
Clicking on Gantt bars (or row) now opens the job.
3. bugfix Turn off Project cookie
Project cookie were confusing, so they have been disabled again.
- When clicking on the Projects tab, it always goes to the project selector, instead of going to the previous project page.
4. feature Compute time auto-scale
Compute times now auto-scale their time units, to represent smaller time duration values. Previously they always rendered in "day" scale.
Examples:
10.2 minstead of0.0 d1.5 hrinstead of0.1 d
5. feature Coverage DB siblings
Regressions containing multiple coverage DB's now have links to sibling DB's.
1.530
1. bugfix Fixed Regression grouping/drilldown
When viewing Grouped Regressions, the list will now properly limit to a single page of results.
- For example, if page size is
200, the resulting page will show up to200unique grouped resuls.
Grouping modes:
- Group-by component
- Group-by run group
- Group-by regression series name
2. bugfix Fixed grouping regex drilldown
When drilling down in grouped regression mode, the Regex selection is kept.
There was a bug in previous releases, where this field would be cleared during drilldown.
3. bugfix Fixed Gantt chart sorting
Gantt charts now sort more intuitively;
- Ascending sort: sort based on job-start timestamps
- Descending sort: sort based on job-finish timestamps
4. bugfix Fixed coverage merge to allow entire page of results to be merged
SIMSCOPE-154
In previous releases, Coverage Merge was limited to 50-model
merge maximum.
Now, it is limited to the page size selection.
- For example, if you have a
200-model page, you can merge200models simultaneously.
1.529
1. feature Subproject within Regression JSON
Regression JSON can now optionally contain a subproject field,
to allow automatic populating of component subproject when a
run is started.
- If the field is blank (or omitted), subproject is left unchanged.
2. feature Added Score Meter in Projects
The Project details page now includes a Score Meter display of each component.
3. feature Added Project cookie
The Project section now includes a cookie to save and restore the previous search configuration.
4. bugfix Signature title search in Triage Report
Filtering the Triage Report by Signature title was broken in previous releases.
This is now fixed.
1.528
1. feature Added support for uniqueid Live publishing
This release adds a simpler Live job matching algorithm based on uniqueid job field.
2. feature Chart: added Group By: Run Group
Charts can now be grouped by Run Group.
3. bugfix Fixed incorrect Score calculation of Aborted regression results
In previous releases, regressions with missing/lost jobs may show an incorrect Score
(e.g. 100%), even if the regression contained lost jobs.
Now the score automatically includes aborted/lost jobs.
4. bugfix Fixed Project Component view with empty components
If Components have no matching jobs inside the Projects page, they now show up grouped under an Empty sub-group, to clarify why they show up as faded out.
5. feature Added Chart configuration: seriesstrippatterns
SIMSCOPE-141
Charts now have an optional configuration seriesstrippatterns, which is a list
of optional regular expressions, allowing shortening of long series names,
when rendering charts.
For example, if you have a long regression called my/super/long/regression/daily/snake/202,
you can add this to your simscope.config to remove the long prefix:
[chart]
# Strip series patterns when rendering charts (regular expressions).
# Example: strip pattern: [my ... daily/]
seriesstrippatterns = "^my.*daily/"
# Also strip 'projectA' (anywhere)
seriesstrippatterns = "projectA"
6. bugfix Fixed a regex Build filter bug
Fixed a bug in regression search where regex field was not propagating when drilling into regression details links.
7. feature Upgraded compile toolchain
This release updates the compile toolchain, requring a minimum Linux OS, equivalent to RedHat7 or higher.
1.527
1. bugfix Regression grouped view pagination fix
In previous releases, when grouping regressions by Component, Series, etc., the summary view could paginate to a single page, containing the first matching 50 regressions incorrectly.
- This resulted in an invalid summary view that was missing records.
This bug is now fixed, so that the summary page should summarize based on 1000 records.
2. bugfix Fixed double-metrics-reindex bug
In previous releases, reindex could be scheduled simultaneously in parallel.
1.526
feature Added merge for formal coverage
Formal coverage DB's can now be merged together.
- Note: identical property names are combined as siblings, rather than merged into a single property.
1.525
1. feature GUI simscope.config editor
The simscope.config can now be edited and saved to disk from
within the Simscope GUI, to allow easier configuration changes without needing a terminal.
2. feature Metrics DB incremental updates
The Metrics DB now supports incremental updates, upon a regression finishing (or timing out).
Charts should now be fresh for all non-live regressions.
Note: this requires a one-time table reindex after installing this release:
- Click Admin Lock → Repopulate Metrics Table
- be patient: this could take a few hours
3. bugfix Chart wide-legend-table
The legend table now automatically shrinks to adjust to the size of the series names in the chart.
In previous releases, this used a fixed width, which could be too wide if there were short series names.
1.524
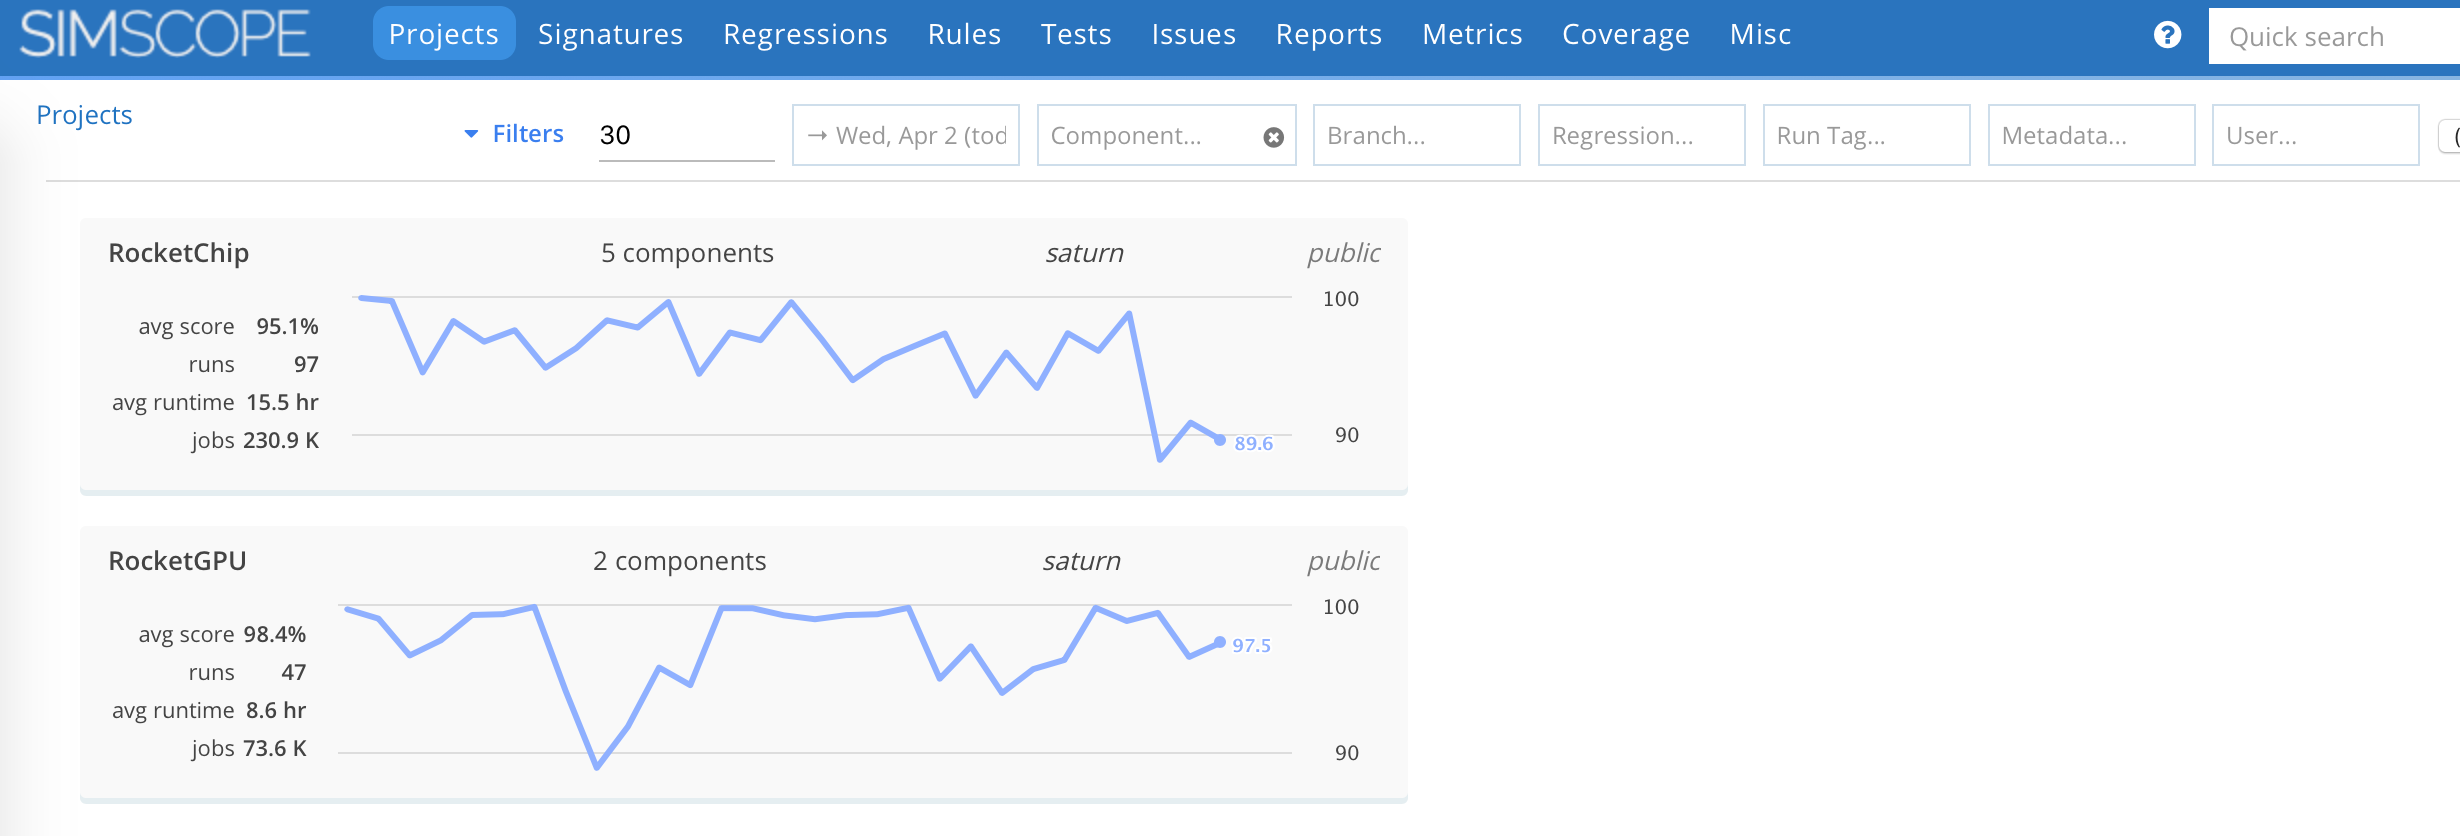
feature New Projects tab
This release contains a new Projects tab, to allow simplified drilldown navigation:
- Project → Component → Regression.
1.523
1. feature Triage percentage collapse algorithm
The Triage calculation has been changed, so that if a signature has been split into:
- NEW + ASSIGNED
Then the triage percentage will merge {NEW+ASSIGNED} together (instead of having separate counts).
- This results in a slightly higher Triage % score.
Note: when calculating the Assignment %, NEW and ASSIGNED counts are both used separately. So the score is the same as previous versions.
2. bugfix 100% charts
Line Charts with a fixed 100% value now render with 100% values at the top of the chart instead of the middle.
3. bugfix Blank charts
Charts with empty datasets now render as a blank/empty chart, instead of showing an error message.
4. feature SMTP CA Certificates
Added SMTP CA Certificates configuration option, to allow custom X.509 certificates.
1.522
feature Regression plugins can now be dynamic
Regression plugins can now be dynamic, so you can save a search that only matches the latest run in a branch/component/etc.
Then when the next regression matching arrives, the plugin will execute against it instead.
1.521
1. featureRegression search by Updated timestamp
Regressions can now be searched by dates using the Update timestamp.
- This allows finding regressions which were run a while ago, but have been updated with coverage or metadata values.
2. feature LDAP dndisablepattern
Added dndisablepattern to the LDAP configuration to allow user disabling
based on their DN (Designated Name) value.
- This feature enables automatically disabling users in Simscope (and free up license seats).
Example:
[ldap]
# Optional: DN Disable Pattern: If your organization disables LDAP users by changing their DN
#           (Designated Name), this variable allows a regular expression to auto-disable a user.
# Note: this requires 'directoryrefresh' to trigger.
#
# Here is an example where users get moved into the OU (Organizational Unit) called Disabled Users:
dndisablepattern = "OU=Disabled Users"

# Refresh the user directory every 24 hours
directoryrefresh = "24h"
3. feature Component Dashboard default
The Component details page now defaults to the component metrics/dashboard view.
4. feature Improved isoweek display
When choosing work week display, Simscope will show a placeholder with the low/high dates automatically.
5. featureAdded Average Regression Runtime to homepage
The homepage now shows average regression runtime for each component.
6. bugfixFixed display of long branch names
Long branch names are now line-wrapped in tables.
Previously these long names would expand tables very wide.
1.520
1. bugfix Fixed simscope-jira-create active bug logic detection
simscope-jira-create.py now has better Active Bug logic.
2. feature Improved job update performance
Job update DB performance has been improved, for large triage updates, by up to 20%.
3. feature Binary integer comparison
Integer values can now be compared with binary syntax.
For example, this searches for a 4-bit value in a metadata field:
perf_reg_int = 0b1101
4. feature New bitwise job metadata slicing
SIMSCOPE-80
Integer-based job metadata fields can now be bitwise indexed (for Rules or searches).
Example:
my_csr01[6:1] < 0x1a
This slices the my_csr01 metadata fields on the bits 6..1 and compares against hex
value 0x1a
- This expression would be equivalent to shifting
my_csr01by one bit andAND-ing the result with `0b
5. feature Added automatic DB integrity check
This now runs an hourly integrity check, and will pause RabbitMQ if the integrity check fails.
To disable the integrity check (not recommended):
[server]
# Skip automatic integrity check (NOT RECOMMENDED)
# skipintegritycheck = true
